



Key Takeaways
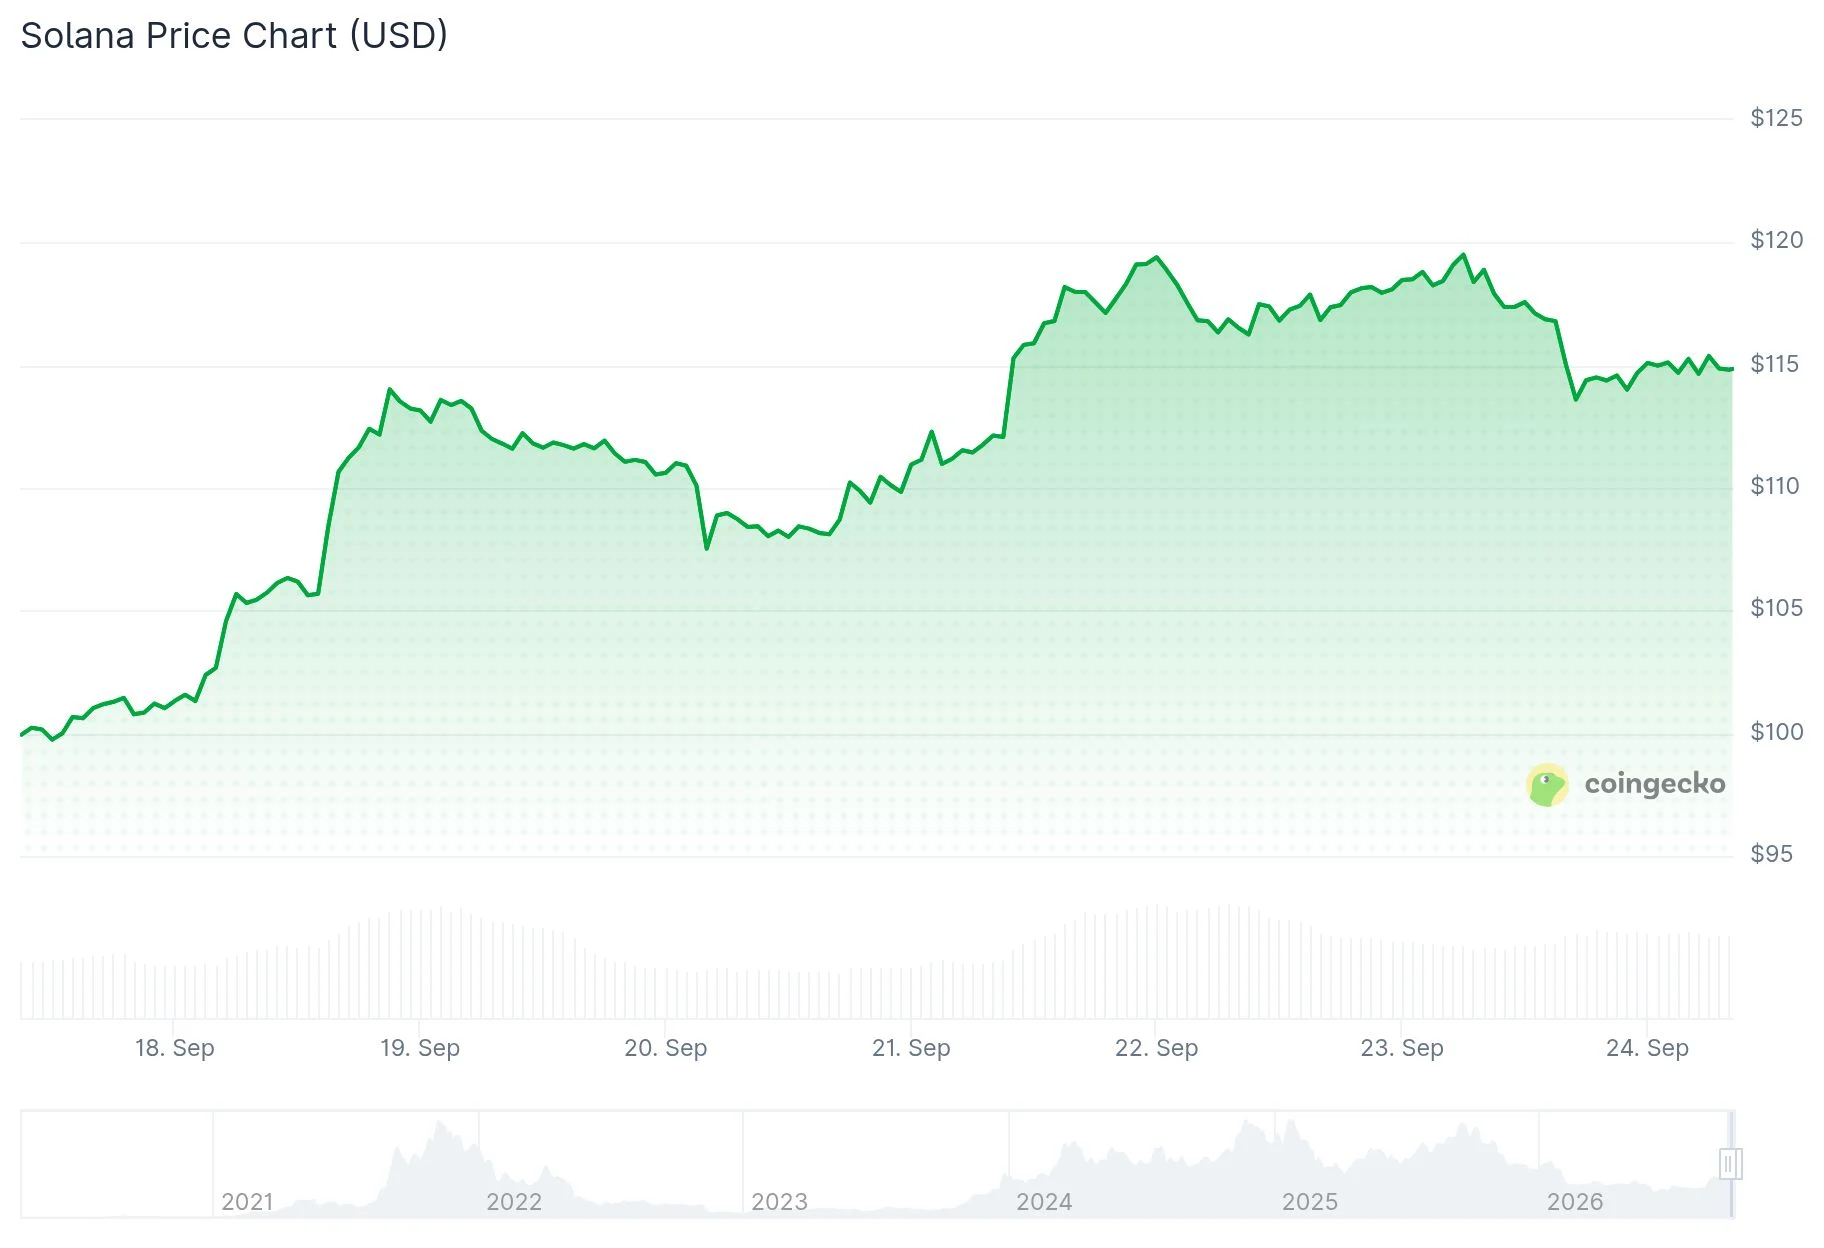
- SOL is changing hands around $117 following a weekly advance of 21%, though it’s still down 44% year-over-year.
- A 152% rally would be necessary for SOL to reach its $295 all-time high recorded in January 2025.
- Network transaction fees have plummeted 97%, declining from $33 million daily to approximately $1 million.
- Spot Solana ETFs recorded $28.87 million in net capital on September 22, bringing cumulative flows to $1.47 billion.
- Market watchers are focused on the $119-$121 resistance band, with the Alpenglow network upgrade scheduled for September 28.
Solana currently trades at $116.87 following a strong 21% weekly performance. Despite this recent momentum, the digital asset remains 44% below its level from twelve months ago. Recovering to its January 2025 all-time high of $295 would require SOL to surge an additional 152% from current prices.
That previous record was achieved during a memecoin trading frenzy, partly fueled by the introduction of the TRUMP token. Network fees reached as high as $33 million per day during that period. Currently, those daily fees hover around $1 million, representing a collapse of roughly 97%.
The circulating supply has expanded since Solana’s peak. Approximately 587 million SOL tokens are now in circulation. If SOL were to reclaim the $295 price point, the network would command a market capitalization approaching $173 billion, surpassing its prior peak valuation of approximately $140 billion.
Institutional Capital Flows Provide Limited Support
Exchange-traded funds represent one avenue for institutional purchasing. United States-based spot Solana ETFs controlled roughly $1.42 billion in assets as of September 17, following twelve consecutive weeks of positive flows.
According to SoSoValue data, these investment vehicles attracted $28.87 million in net inflows on September 22 alone. This pushed aggregate inflows to $1.47 billion, with total net assets standing at $1.77 billion.

Tokenized equity products represent another demand driver. Solana currently hosts approximately $465 million worth of these instruments, exceeding all competing blockchains. The Securities and Exchange Commission provided trading platforms with a five-year exemption for this category on September 17.
Market analyst SatoshiOwl highlighted a recent price action that aligned with his previous projection. He stated: “Called it. Yesterday I said $SOL looked ready for a pullback into the $113–114 zone before the next leg up. And that’s EXACTLY what happened. #SOL just wicked straight into that area and bounced.” He mentioned he’s now monitoring $120 initially, followed by $124 if underlying support maintains.
Key Technical Barriers and Indicator Signals
Solana confronts overhead resistance in the $119 to $121 range. CoinGlass liquidation information reveals a concentrated grouping of positions between $116.80 and $117.30, situated near current trading levels.
A sustained push above $120 may initiate liquidations extending toward the $121 to $123 area, based on heatmap analysis. Conversely, a decline beneath $110 would deteriorate the short-term technical picture.
Analyst Crypto Patel observed that SOL has already doubled from his previous accumulation zone of $60 to $67, advancing beyond $120 before retracing to present levels. He indicated his extended-term objective of $500 to $1,000 stays intact despite the recent correction, while acknowledging a potential intermediate-term decline toward $50.
The daily Relative Strength Index stands around 70, indicating the asset might be overbought following its swift ascent. Analyst Redlion characterized the configuration as promising, provided buyers continue protecting the $110 to $111 support area.
Redlion further noted that a decisive breakthrough above $121 might unlock momentum toward $123 or beyond. He emphasized that slipping back under $110 would shift sentiment bearish once more.
All major moving averages currently trade beneath the spot price. The 20-day exponential moving average is positioned at $106.76, the 50-day at $97.82, the 100-day at $91.22, and the 200-day at $93.37.
The MACD indicator shows a value of 5.49, positioned above its signal line at 4.31, with a positive histogram registering 1.19. Derivatives volume contracted 19.11% to $9.78 billion, while open interest decreased 1.41% to $7.13 billion.
The Alpenglow network upgrade is slated for September 28 and targets reducing transaction finality times to approximately 150 milliseconds. SOL must first achieve a close above $124, matching its December 31, 2025 level, before attempting to challenge the $149 to $150 region from January 2026.
Get 3 Free Stock Ebooks
Discover top-performing stocks in AI, Crypto, and Technology with expert analysis.
- Top 10 AI Stocks - Leading AI companies
- Top 10 Crypto Stocks - Blockchain leaders
- Top 10 Tech Stocks - Tech giants



