



Key Takeaways
- ETH currently trades near $2,664 following a decisive break above its September consolidation zone.
- The cryptocurrency surged past the critical $2,560 resistance and successfully defended it on pullback.
- Daily price action indicates ETH touched $2,700, positioning $2,760 as the subsequent resistance objective.
- The Relative Strength Index reads 67.16, indicating robust upward pressure without entering overbought territory.
- The MACD indicator has flipped bullish once more, reinforcing the validity of the current breakout pattern.
Ethereum (ETH) climbed beyond the $2,600 threshold on September 21 following a decisive breach of a resistance barrier that had constrained upward movement throughout the previous month.
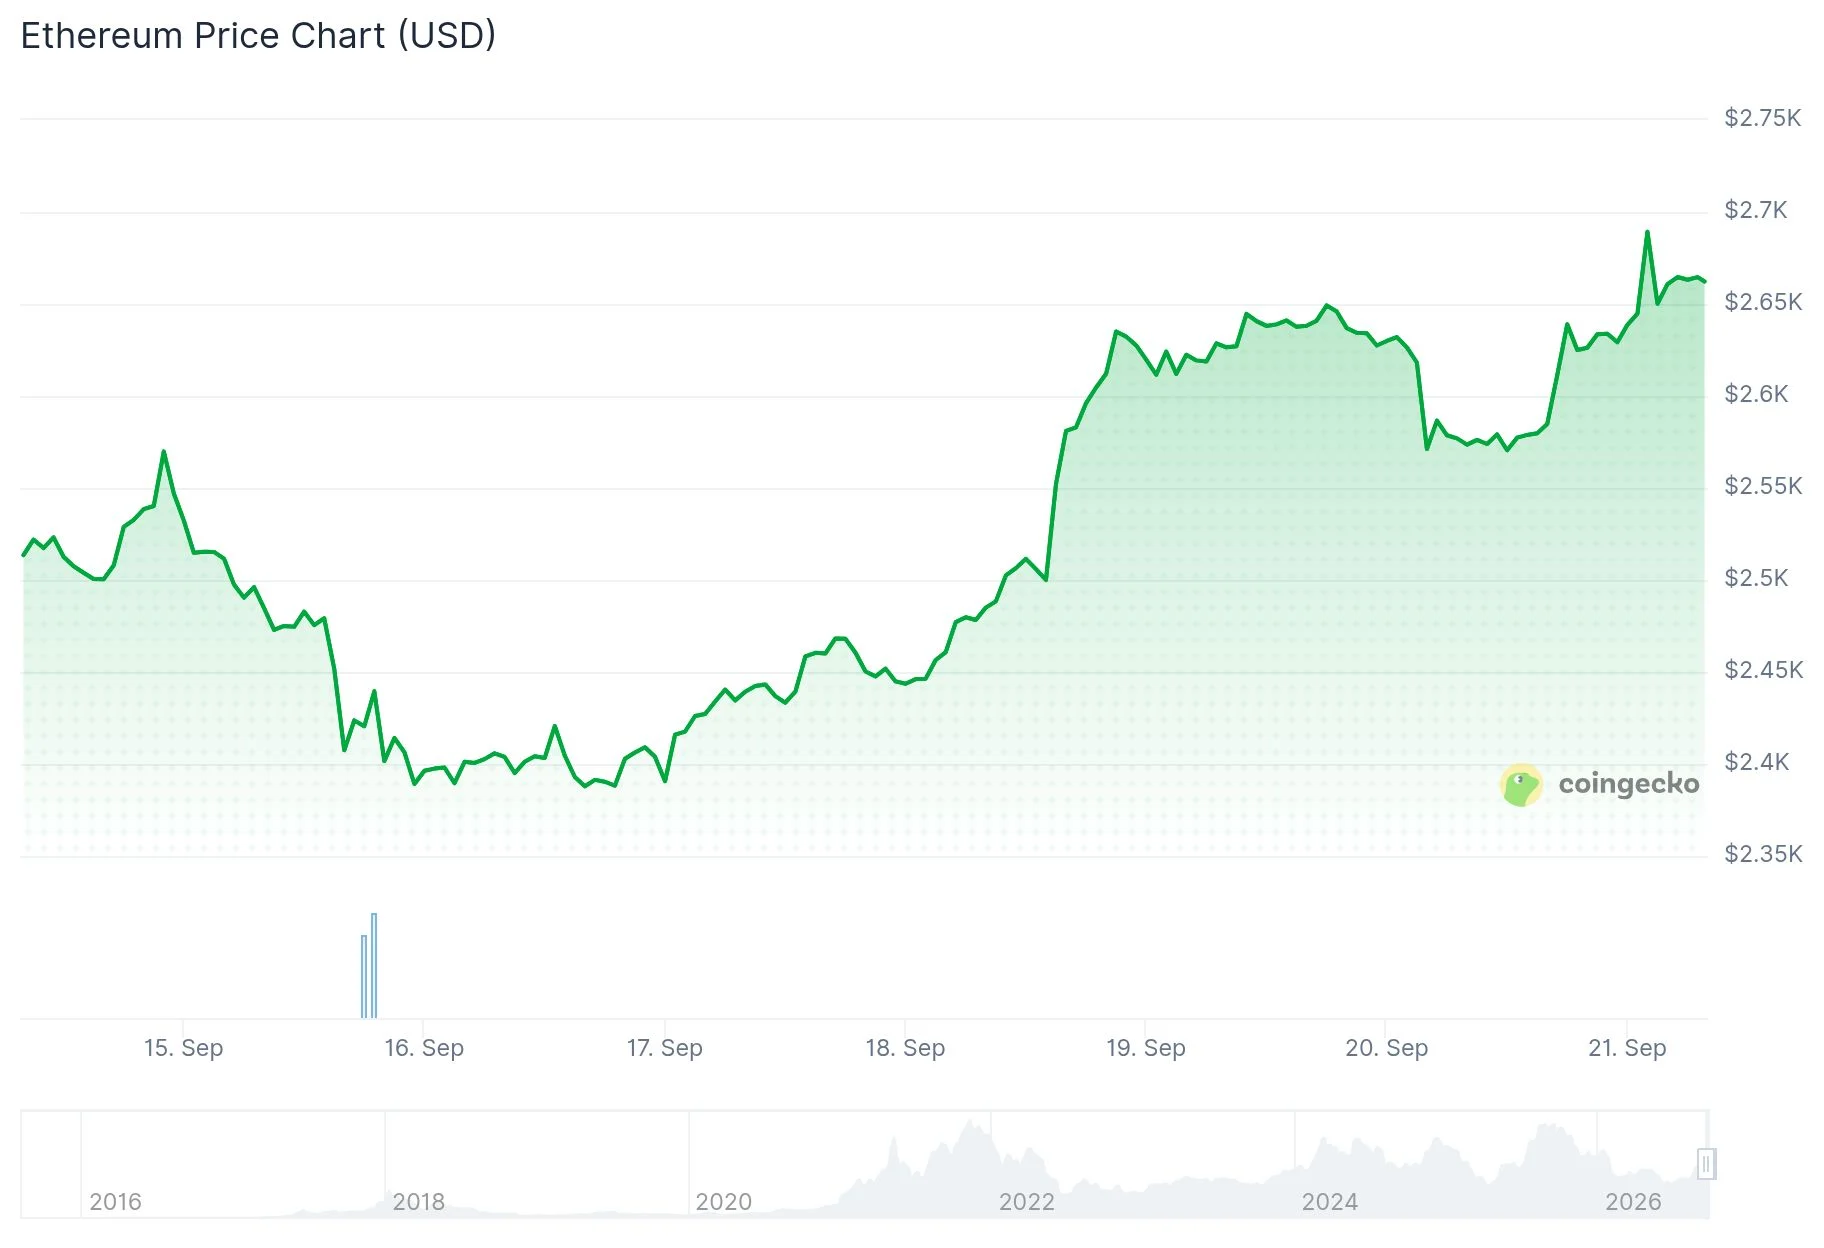
The second-largest cryptocurrency by market capitalization began the session around $2,645 before advancing to a session peak of $2,700. At chart capture, ETH was changing hands near $2,664.
This upward momentum represents a continuation of Ethereum’s rebound from the June trough around $1,500. The daily timeframe reveals a pattern of progressively higher lows since that bottom.
An ascending trendline originating from the June floor remains unbroken. This technical support structure has underpinned the recovery phase across the July, August, and September periods.
Late August witnessed accelerated gains for Ethereum, with prices vaulting from sub-$1,900 levels to above $2,300. Following this rally, the asset entered a narrower consolidation phase prior to the current breakout.

Critical $2,560 resistance level conquered
The pivotal technical milestone involves Ethereum’s surge beyond the $2,560 zone. Following the initial penetration, ETH has successfully maintained prices above this threshold.
Market analyst Ali Charts characterized this price behavior as a validated breakout. In commentary shared on X, he noted that Ethereum cleared the $2,560 barrier, successfully validated it as fresh support during a pullback, and is now advancing toward higher levels.
According to Ali Charts, the $2,760 level represents the subsequent major objective provided the breakout structure holds firm.
This target resides above the session’s $2,700 peak. Breaching the $2,700 mark would place immediate attention on the $2,760 resistance zone.
The previous $2,500-$2,560 resistance band has now transformed into the primary nearby support region. Maintaining elevation above this zone would preserve the integrity of the breakout formation.
Technical indicators signal strengthening trend
Momentum gauges for Ethereum have exhibited positive developments. The daily Relative Strength Index currently registers 67.16.
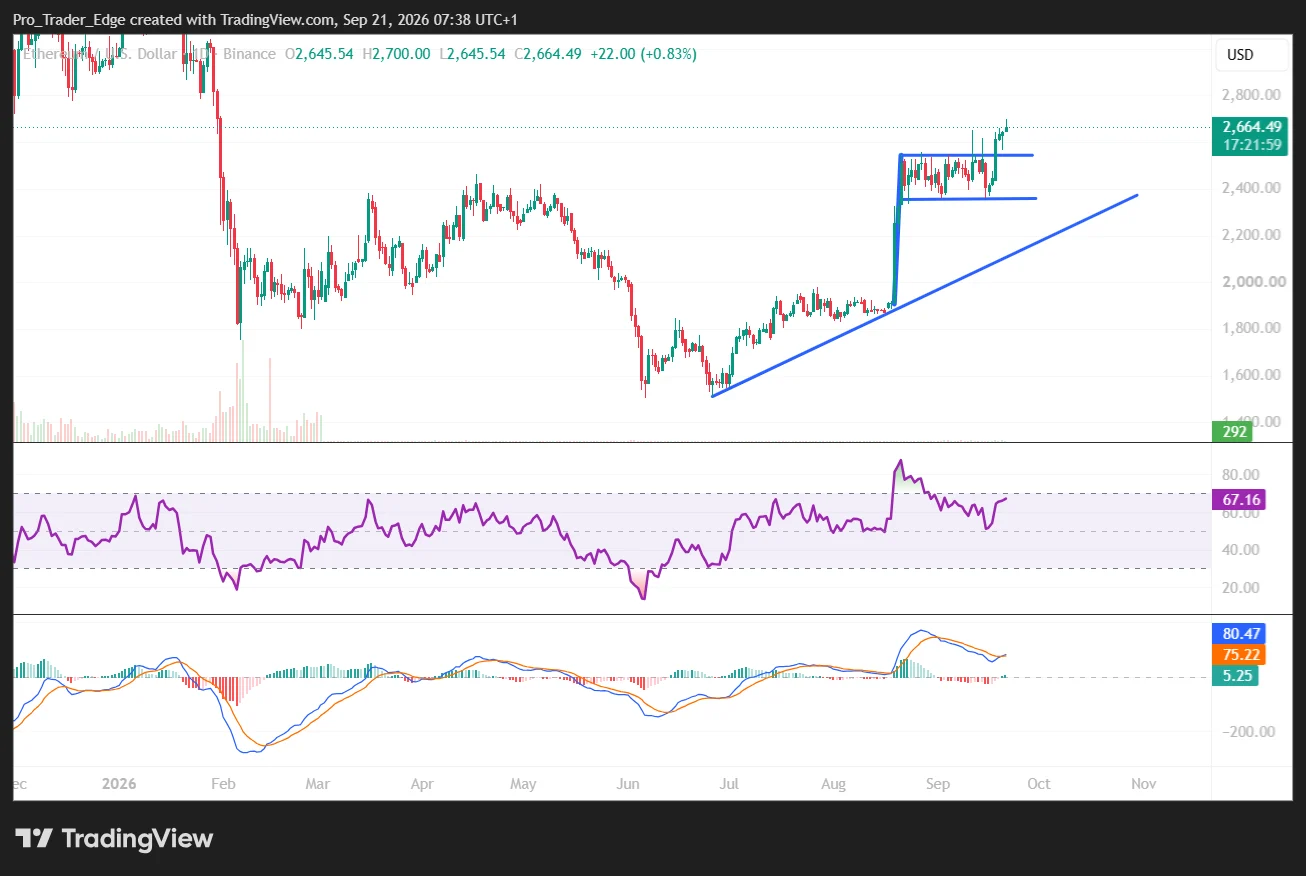
This measurement positions the RSI beneath the widely monitored 70 threshold that signals overbought conditions. The current reading demonstrates increasing demand without venturing into extreme territory.
The MACD oscillator is trending upward again after the September consolidation phase. The MACD line stands at approximately 80.47, while the signal line measures 75.22.
The histogram has returned to positive values at roughly 5.25. This development indicates that near-term momentum has gained strength in conjunction with the breakout move.
The broader chart perspective reveals Ethereum still trading beneath the price levels observed at the start of 2026, when ETH approached the $3,000 mark.
Currently, ETH maintains its position above the $2,560 breakout zone after touching $2,700, with market analyst Ali Charts monitoring $2,760 as the next significant upside objective.
Get 3 Free Stock Ebooks
Discover top-performing stocks in AI, Crypto, and Technology with expert analysis.
- Top 10 AI Stocks - Leading AI companies
- Top 10 Crypto Stocks - Blockchain leaders
- Top 10 Tech Stocks - Tech giants



