



Key Highlights
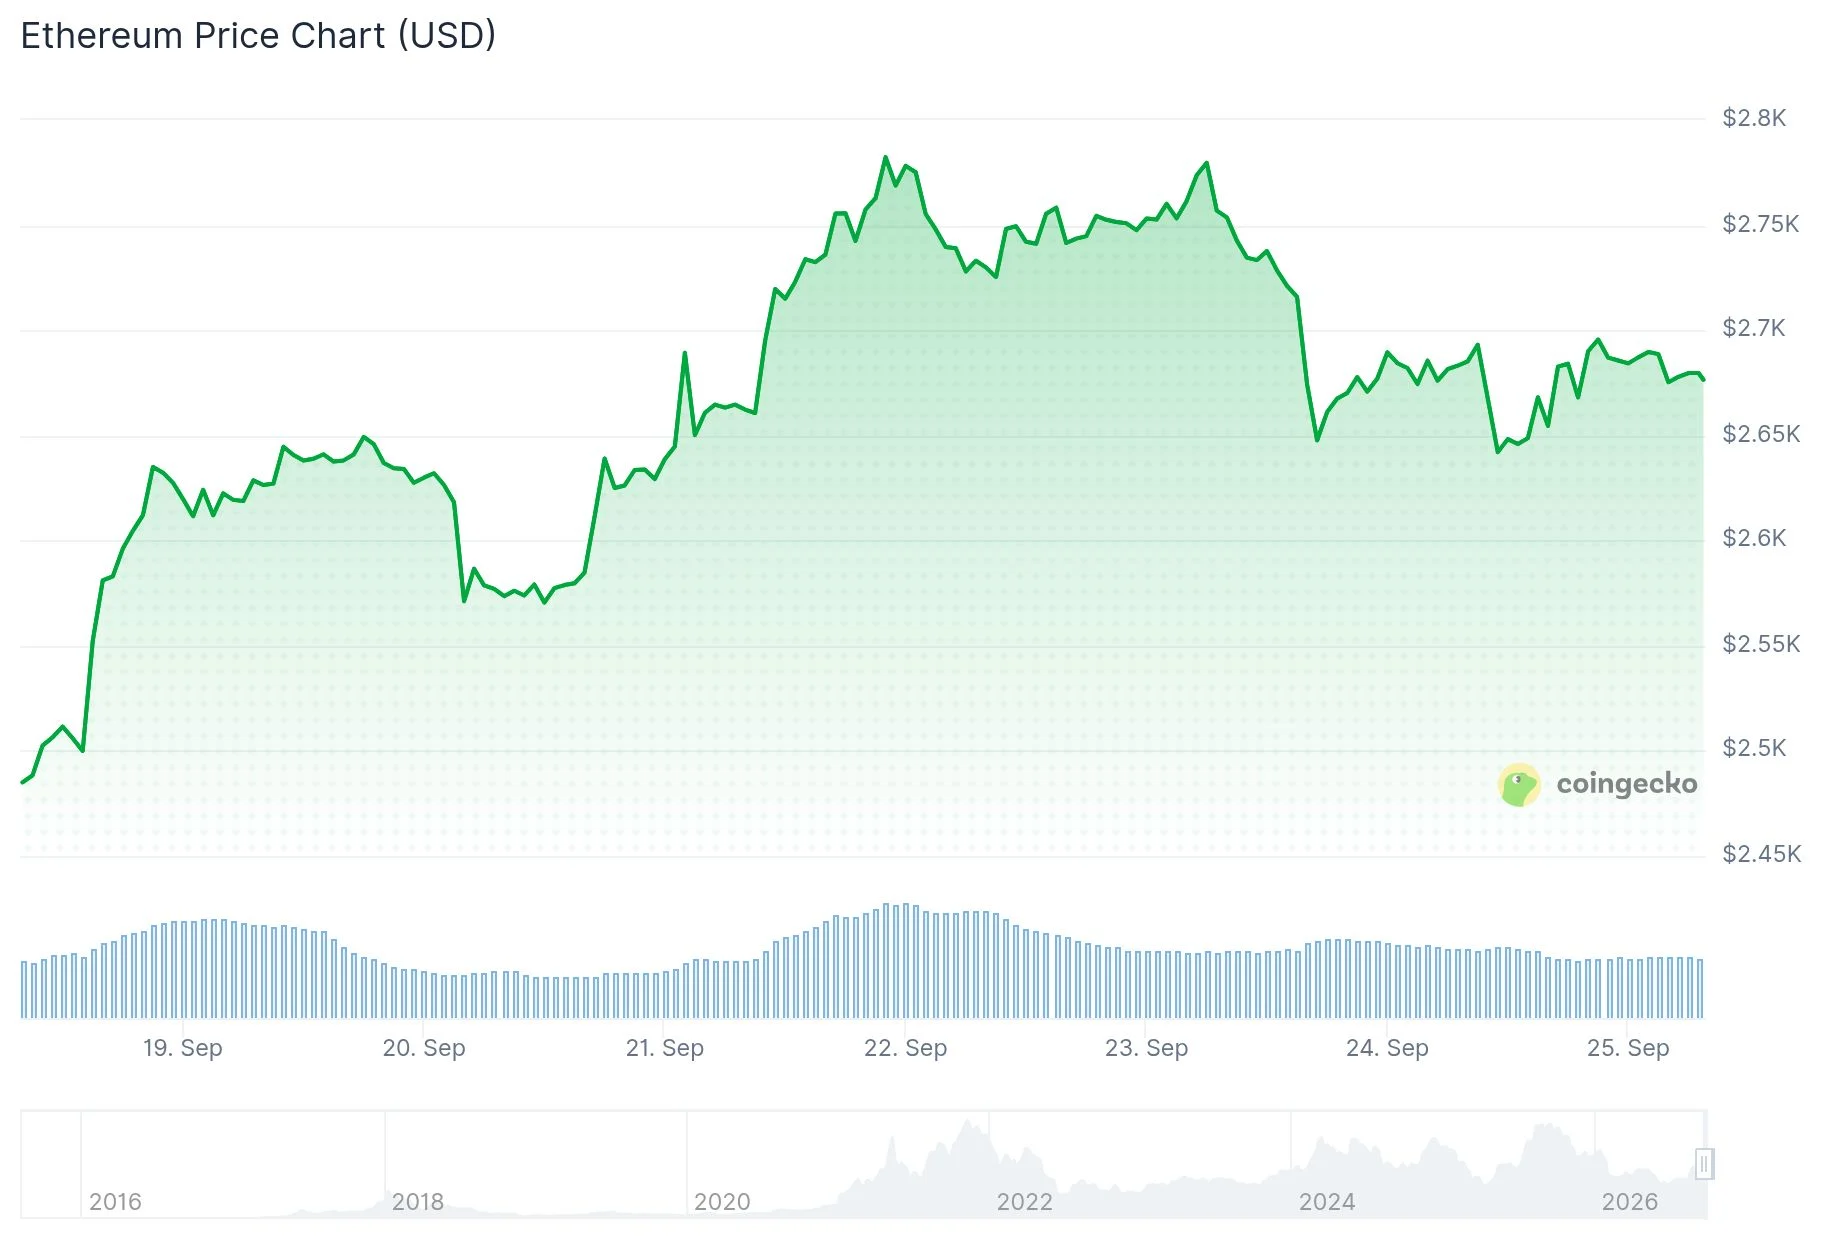
- ETH currently trades around $2,680, gaining 0.40% during the last 24-hour period
- Major holders controlling 10K-100K ETH accumulated 260K tokens starting Saturday, reversing previous week’s selloff
- Spot Ethereum ETFs in the United States recorded their fourth consecutive session of positive net flows, totaling $104.6 million
- ETHA from BlackRock dominated inflows with $50.8 million on September 23
- Critical support zone between $2,560-$2,600 undergoes testing as former resistance converts to potential support
Ethereum’s current price stands at $2,680, reflecting a modest 0.40% increase during the previous day’s trading session. The digital asset maintains a market capitalization hovering around $328 billion.
Major Ethereum stakeholders have shifted back to accumulation mode. Addresses containing between 10,000 and 100,000 ETH have acquired 260,000 tokens since Saturday, based on information from CryptoQuant.
This accumulation pattern reverses recent selling pressure from the previous week. The identical cohort of large holders liquidated 140,000 ETH across a three-day period following the Senate’s stalling of the Clarity Act.
Mid-tier holders exhibited contrasting patterns. Addresses containing 1,000 to 10,000 ETH maintained relatively stable holdings until executing a modest 50,000 ETH distribution during the last 48 hours.
Holders in the 100 to 1,000 ETH category have maintained consistent selling pressure. This segment has distributed approximately 140,000 ETH following the emergence of Clarity Act developments.

Exchange flow metrics indicate withdrawals currently exceed deposits. This pattern implies certain market participants are accumulating during price declines while others realize gains.
Institutional Appetite Remains Robust
United States-based spot Ethereum exchange-traded funds recorded a fourth consecutive session of positive net flows. Wednesday’s aggregate inflows reached $104.6 million.
BlackRock’s ETHA product dominated institutional flows with $50.8 million. This figure represents approximately half of Wednesday’s cumulative inflow.
Fidelity’s FETH product followed closely, attracting $41.3 million during the identical trading session.
Market analyst Ted, recognized by the handle @TedPillows, offered perspective on current price dynamics. He indicated ETH is undergoing a minor pullback and anticipates a retest near $2,550 before upward continuation.
Critical Price Level Under Scrutiny
Another market observer operating under the pseudonym BATMAN highlighted the $2,560-$2,600 territory as a significant technical zone for ETH. This region previously functioned as resistance and has undergone multiple support tests since.
Should ETH maintain this zone throughout current pullback activity, it would validate the conversion of previous resistance into reliable support. The 200-day exponential moving average positions nearby around $2,460, providing traders an additional reference point.
Technical indicators show ETH trading above the median Bollinger Band, currently positioned at $2,547.65. The upper boundary registers at $2,767.17.
The MACD indicator reads 96.50, positioned above its signal line at 86.47. The histogram displays a positive reading of 10.02, although the spread between lines remains narrow.
Liquidation data from Coinglass reveals $74.5 million in forced closures throughout the past 24 hours. Long position liquidations accounted for $44.4 million of this figure.
Overhead resistance zones beyond current pricing include $2,786 and $2,894, with an additional obstacle positioned at $3,177.
Regarding broader market conditions, Brent crude advanced nearly 3% Thursday following the collapse of US-Iran diplomatic discussions. The 10-year US Treasury yield surpassed 5.15%, marking its peak level since June 2007.
Get 3 Free Stock Ebooks
Discover top-performing stocks in AI, Crypto, and Technology with expert analysis.
- Top 10 AI Stocks - Leading AI companies
- Top 10 Crypto Stocks - Blockchain leaders
- Top 10 Tech Stocks - Tech giants



