



Key Takeaways
- Ethereum ETFs recorded $70.48 million in net inflows on July 8, marking five consecutive days of positive flows
- Bitcoin ETFs experienced $84.86 million in outflows the same day, highlighting a divergence in institutional appetite
- ETH remains capped below critical resistance at $1,826, limiting near-term upside potential
- Historical data shows the $1,580 support area previously sparked rallies of 149% and 203%
- Technical indicators present conflicting signals with bearish moving averages but bullish momentum oscillators
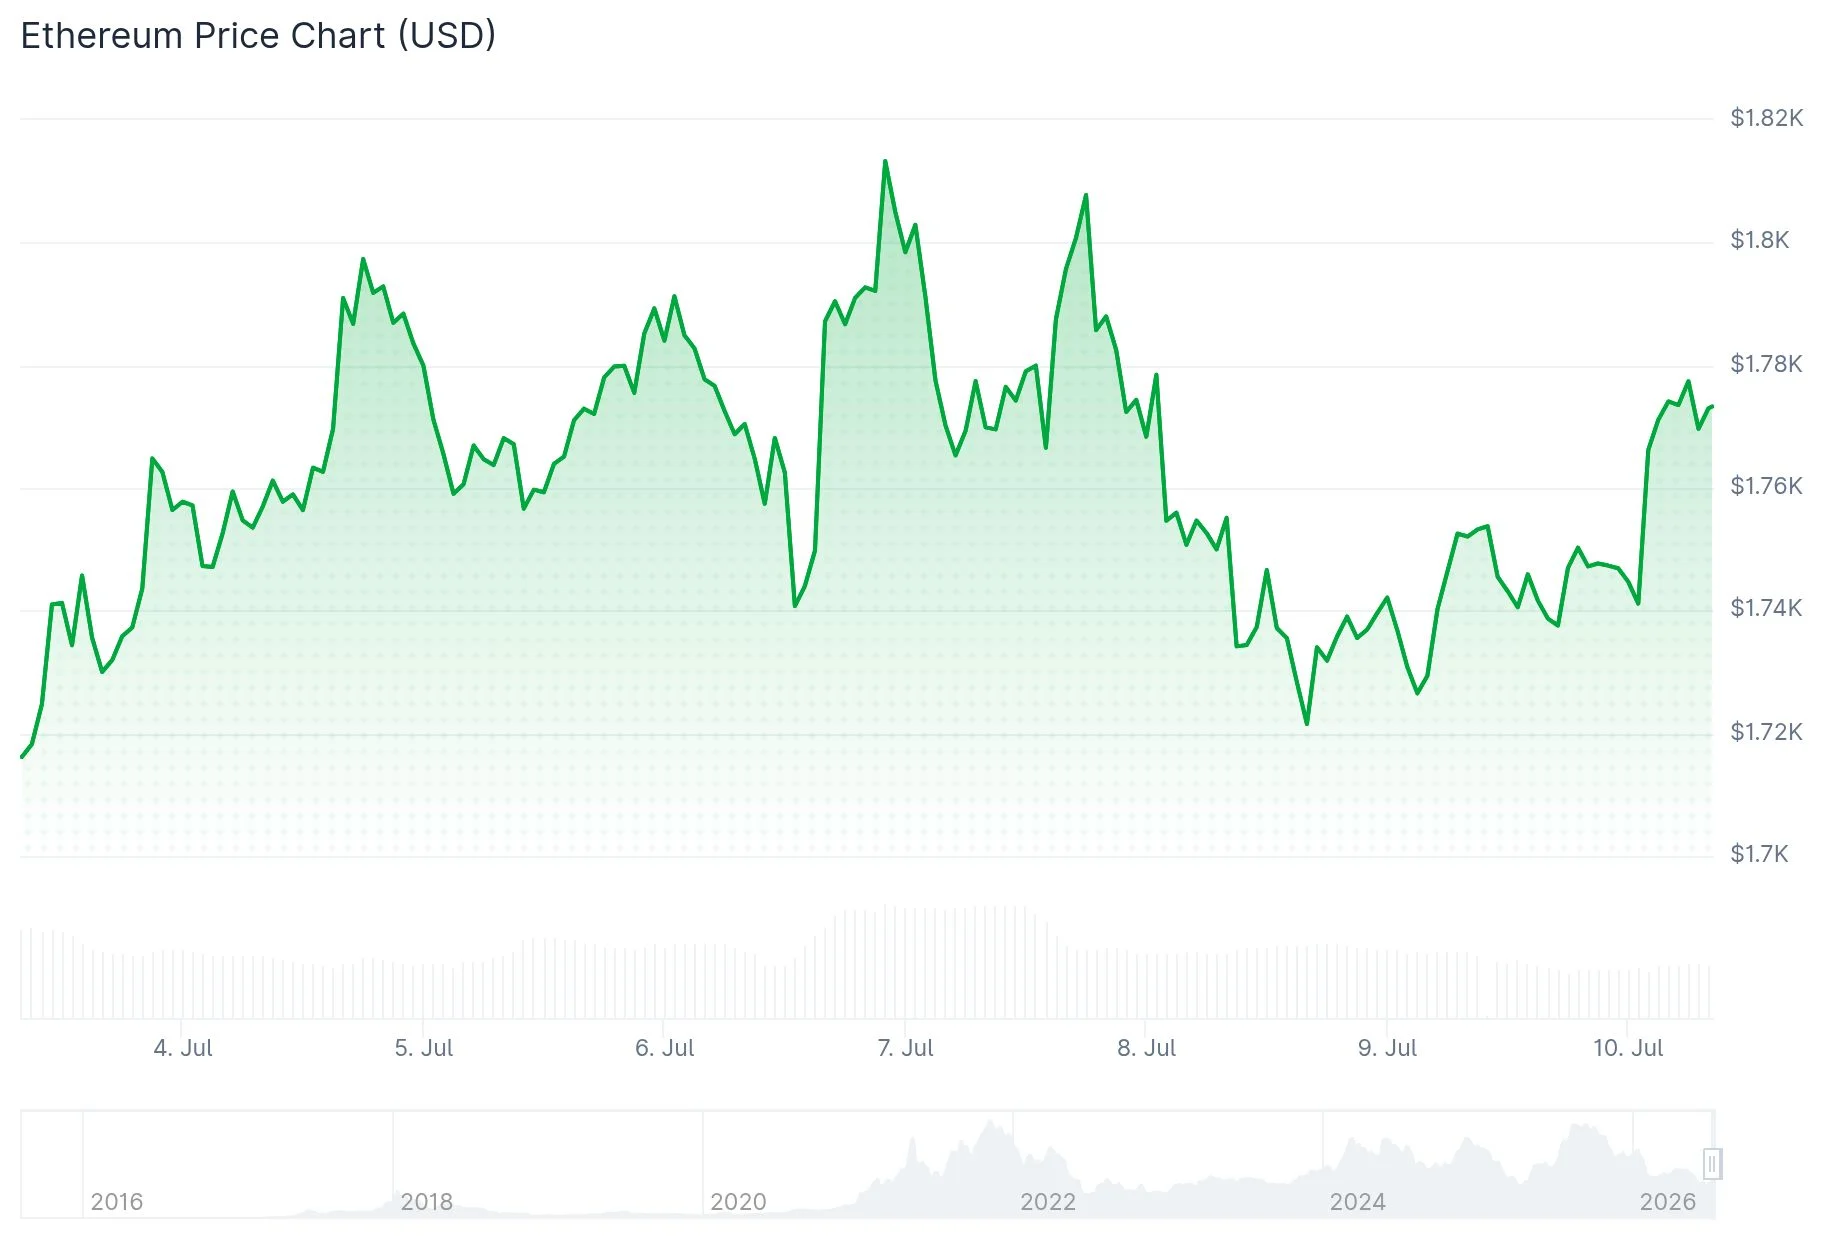
Ethereum continues to trade within a compressed range, caught between lackluster momentum and a significant resistance barrier near $1,826. While the asset has gained approximately 10% in the past seven days, it has failed to sustain levels that would validate a more meaningful bullish reversal.
According to data from SosoValue, spot Ethereum ETFs attracted $70.48 million in net inflows on July 8. This marks the fifth consecutive session of positive flows into Ethereum-focused investment products.
Meanwhile, Bitcoin ETFs painted a contrasting picture during the same trading session, shedding $84.86 million in capital. The divergence suggests institutional investors are currently favoring Ethereum exposure over Bitcoin allocations.
Crypto market analyst CryptosBatman highlighted a developing technical formation on ETH’s chart via X. He noted that Ethereum is forming an identical bull flag continuation structure that preceded significant upward price action in previous instances, suggesting a confirmed breakout could propel ETH approximately 13% higher from current levels.
Technical Indicators Present Mixed Signals
The current technical landscape for Ethereum reveals conflicting directional cues. Major moving averages such as the MA50, MA100, and MA200 are uniformly displaying bearish signals. Substantial resistance exists within the $1,800 to $1,826 range, with the 50-day exponential moving average positioned at $1,804.

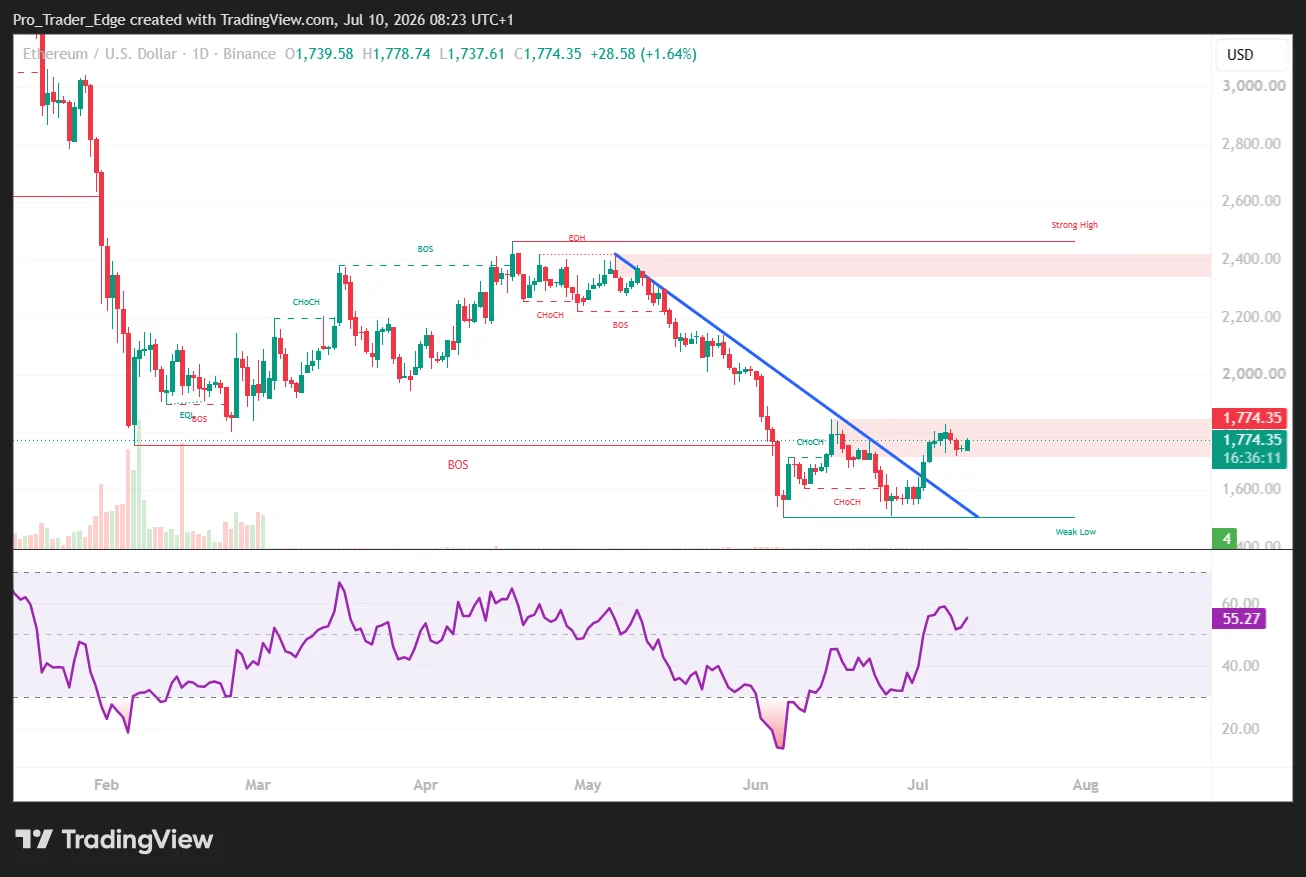
Conversely, momentum indicators including the RSI (14) and STOCH (9,6) are exhibiting bullish characteristics. For bulls to establish control, ETH must decisively break and hold above the $1,800–$1,850 resistance cluster to open the path toward the psychological $2,000 threshold.
Analyst Cryptorphic emphasized that ETH maintains a bearish structure as long as it trades beneath $1,826, and only a reclaim and sustained hold above this level would shift the technical outlook toward a more constructive bias.
Critical $1,580 Support Zone Under Scrutiny
On the weekly timeframe, Ethereum is once again challenging the pivotal $1,580 support area. Market analyst Ali Charts notes this level previously catalyzed a 149% rally in October 2023 and triggered a 203% surge following its test in April 2025.
ETH has rebounded from the $1,580 threshold back toward the $1,800 region. However, repeated tests of identical support zones can gradually deplete buying interest and diminish the reliability of these levels over successive touches.
CryptoQuant’s on-chain metrics reveal the Net Unrealized Profit/Loss indicator improved from -0.46 to -0.30. This data indicates the majority of ETH holders remain underwater on their positions, though aggregate unrealized losses have moderated.
Ethereum has maintained trading above $1,750 despite escalating geopolitical friction between the United States and Iran, demonstrating resilience compared to ETH’s historical sensitivity to comparable international developments.
Large holder activity shows wallets containing 10,000 to 100,000 ETH accumulated approximately 100,000 ETH during the previous week, though aggregate balances in this cohort have remained relatively stable across the past three-week period.
Get 3 Free Stock Ebooks
Discover top-performing stocks in AI, Crypto, and Technology with expert analysis.
- Top 10 AI Stocks - Leading AI companies
- Top 10 Crypto Stocks - Blockchain leaders
- Top 10 Tech Stocks - Tech giants



