



Key Highlights
- ETH encountered resistance below the $2,000 mark following its climb from approximately $1,520.
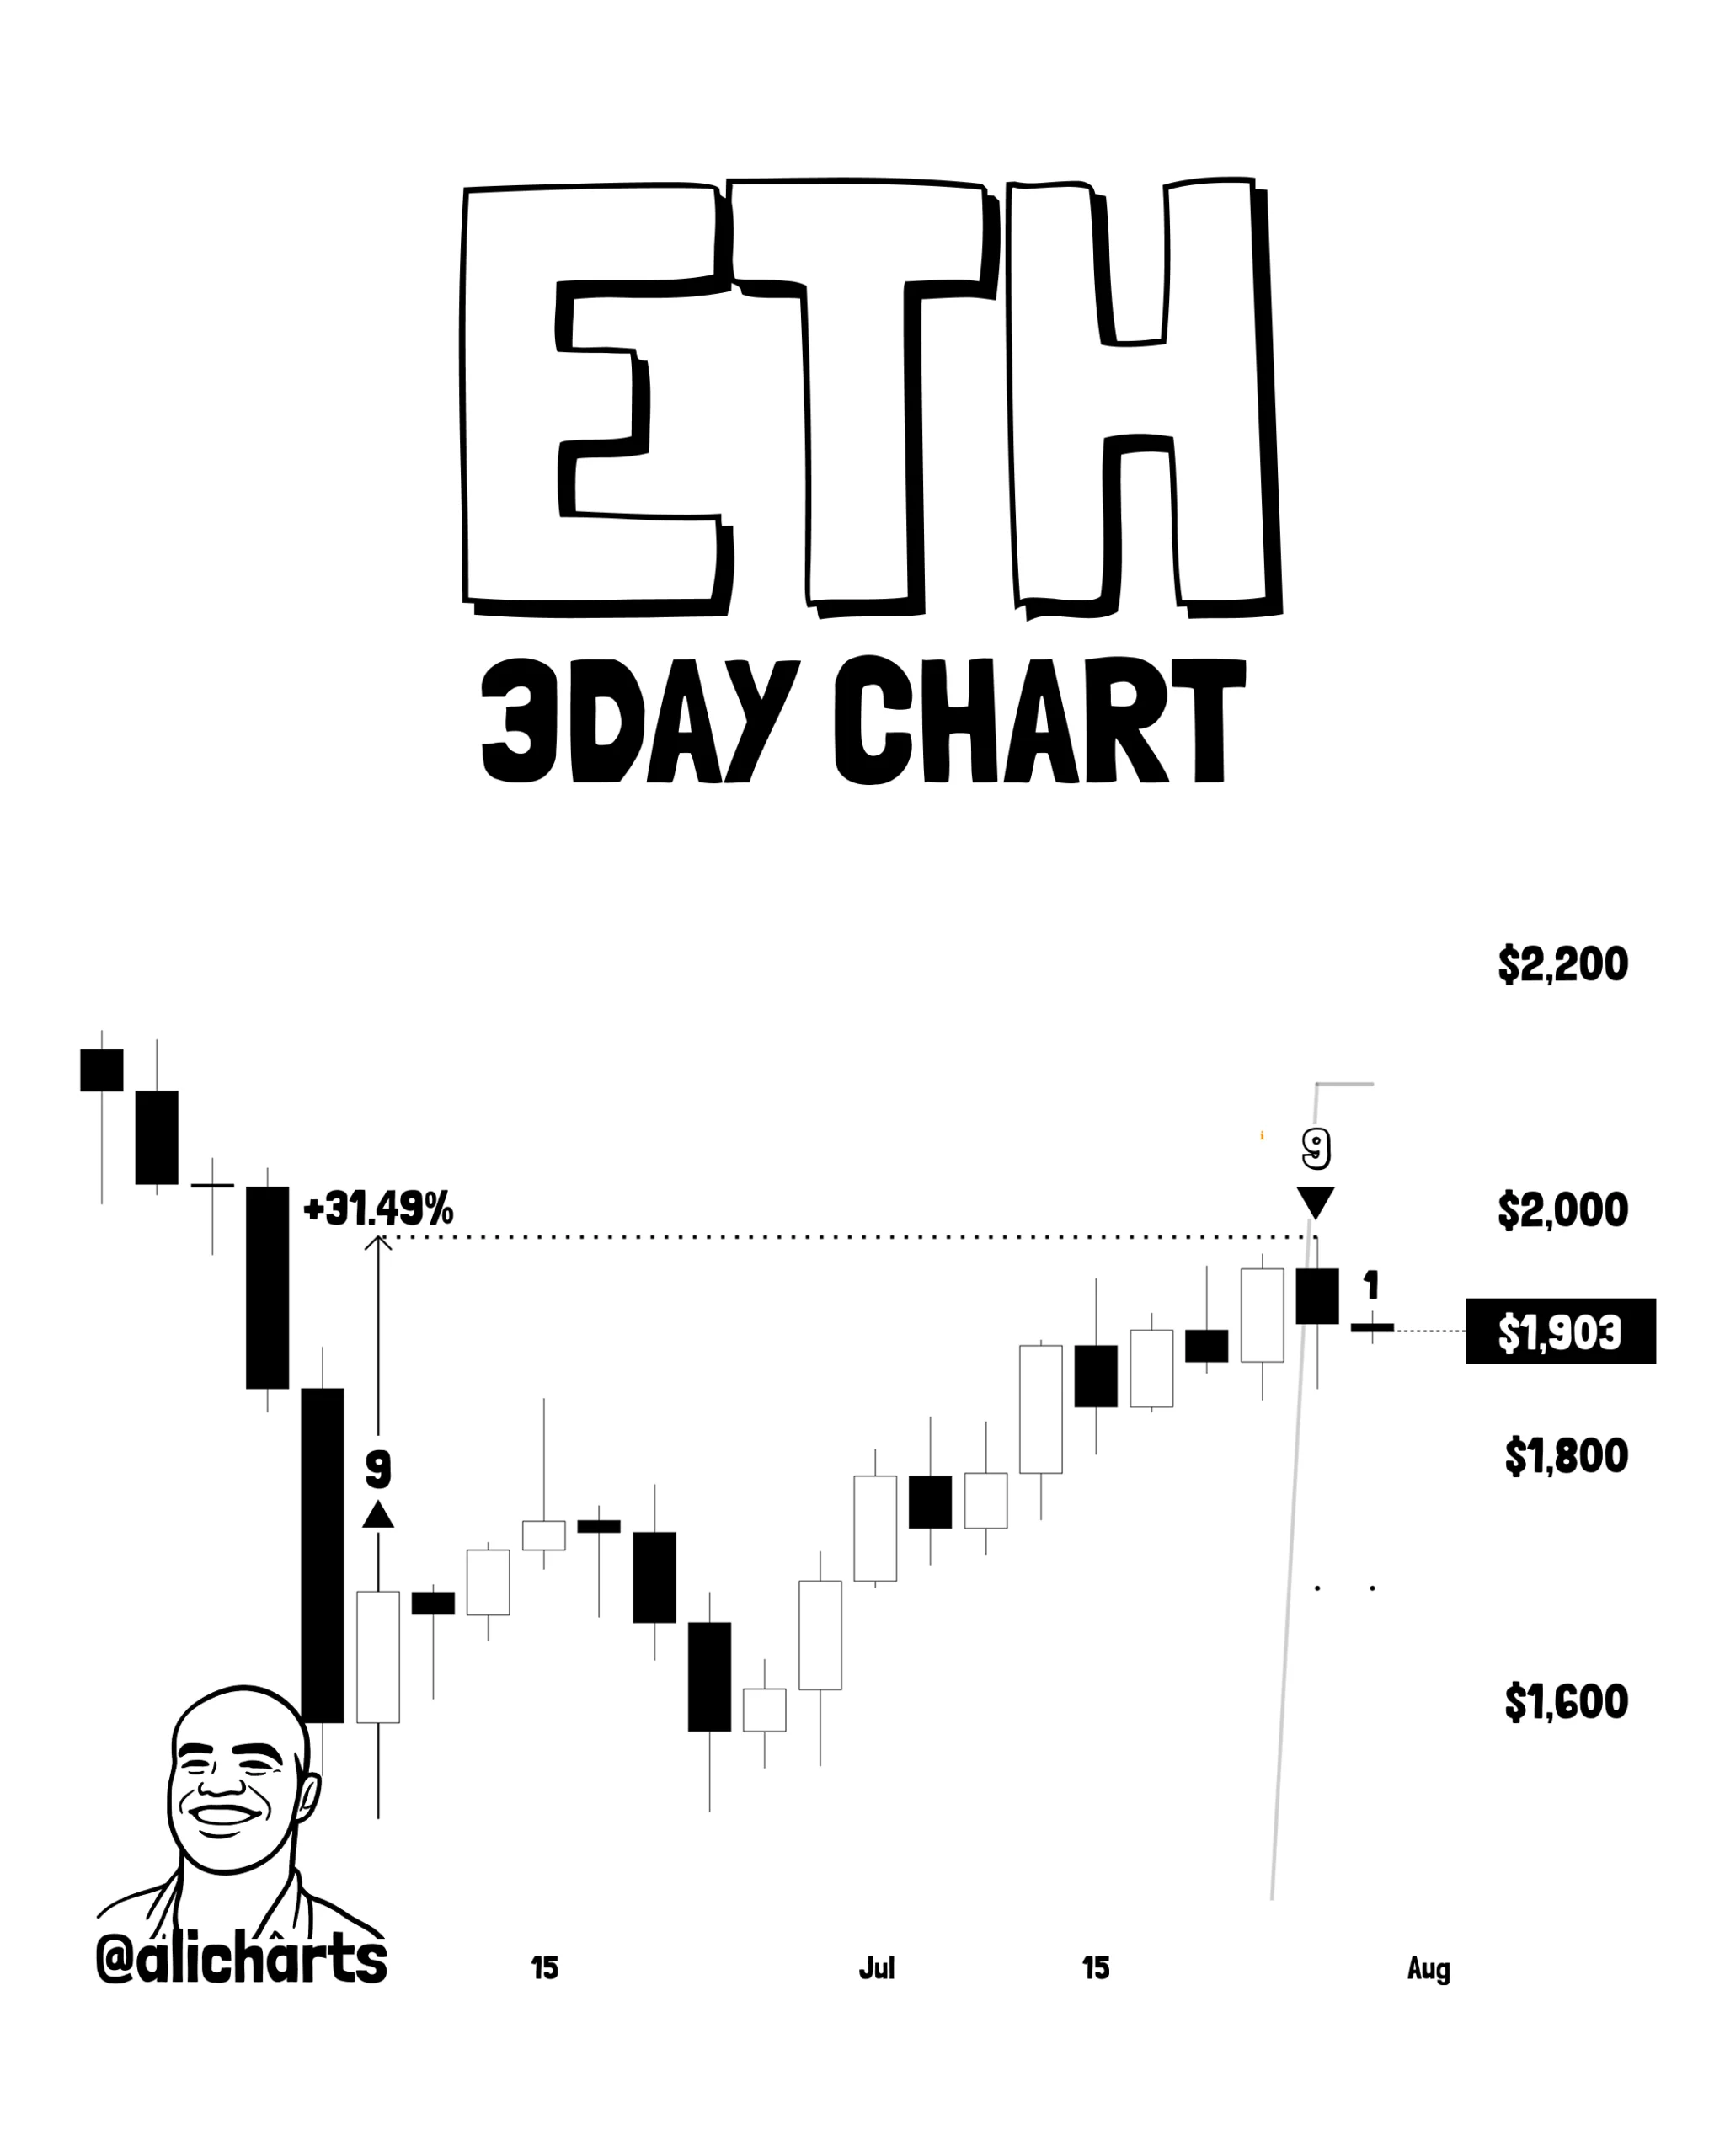
- The TD Sequential indicator shifted to a sell signal after accurately predicting Ethereum’s July recovery.
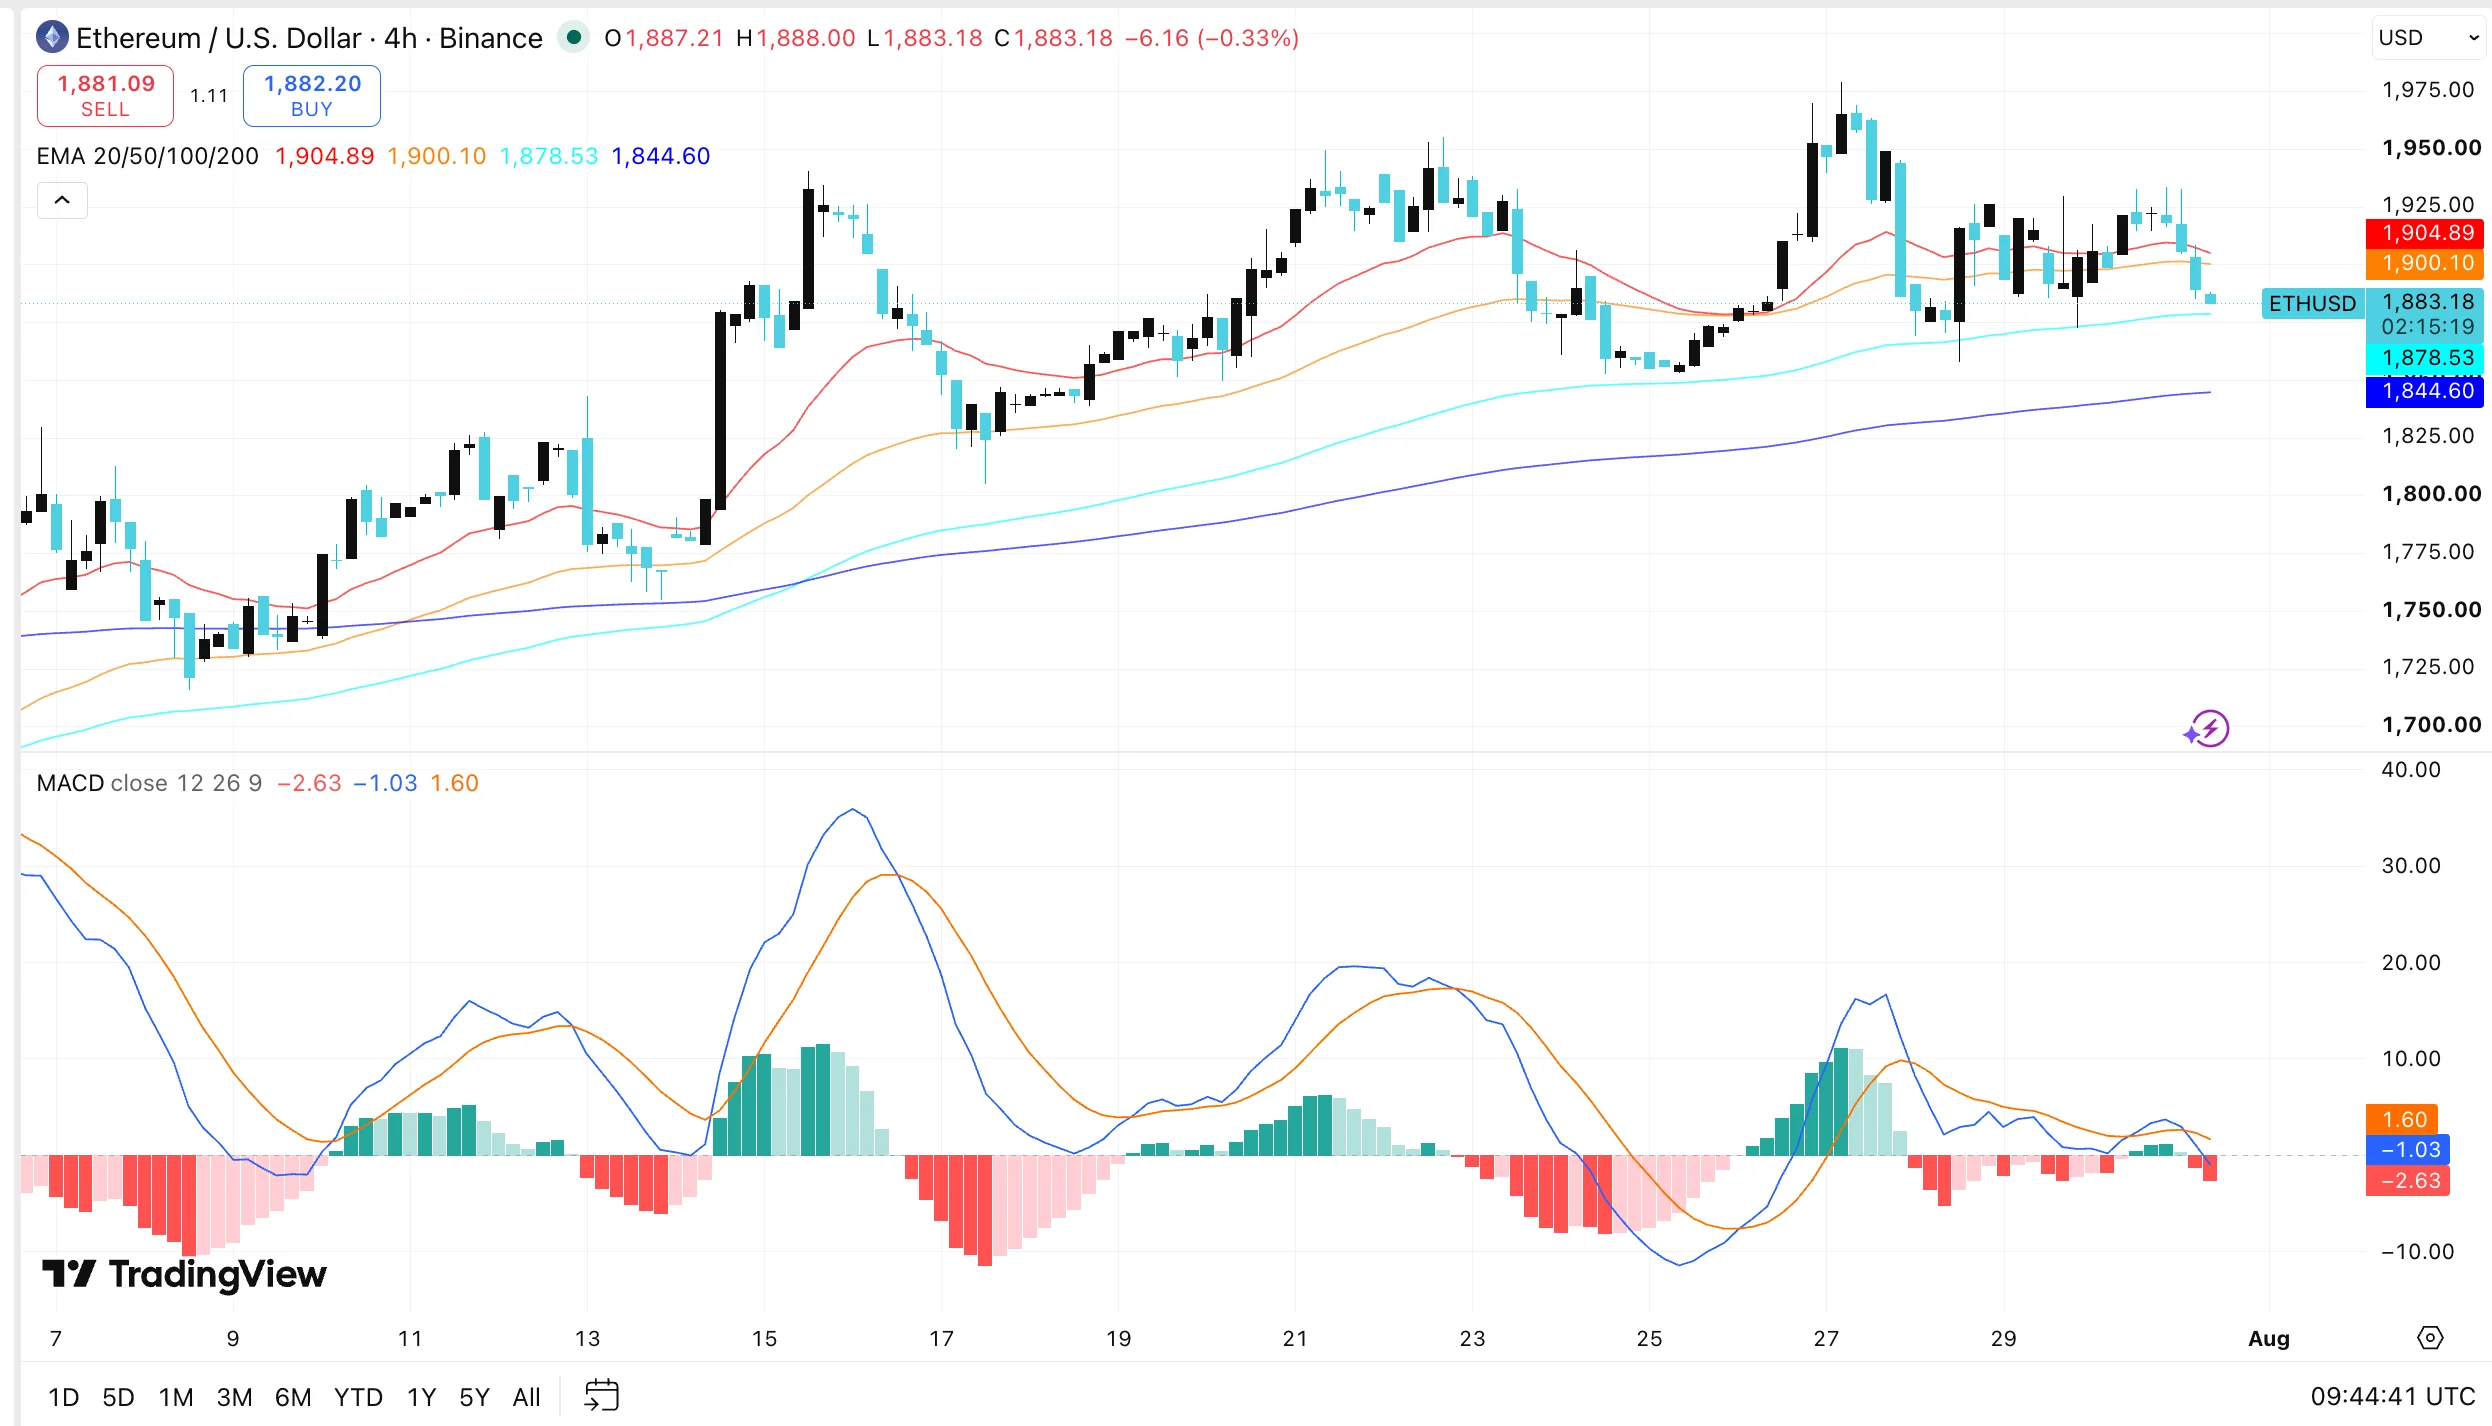
- Ethereum positioned itself below both the 20-period and 50-period EMAs on the four-hour timeframe.
- Critical support held near $1,878, while the 200-period EMA around $1,844 represents the subsequent downside target.
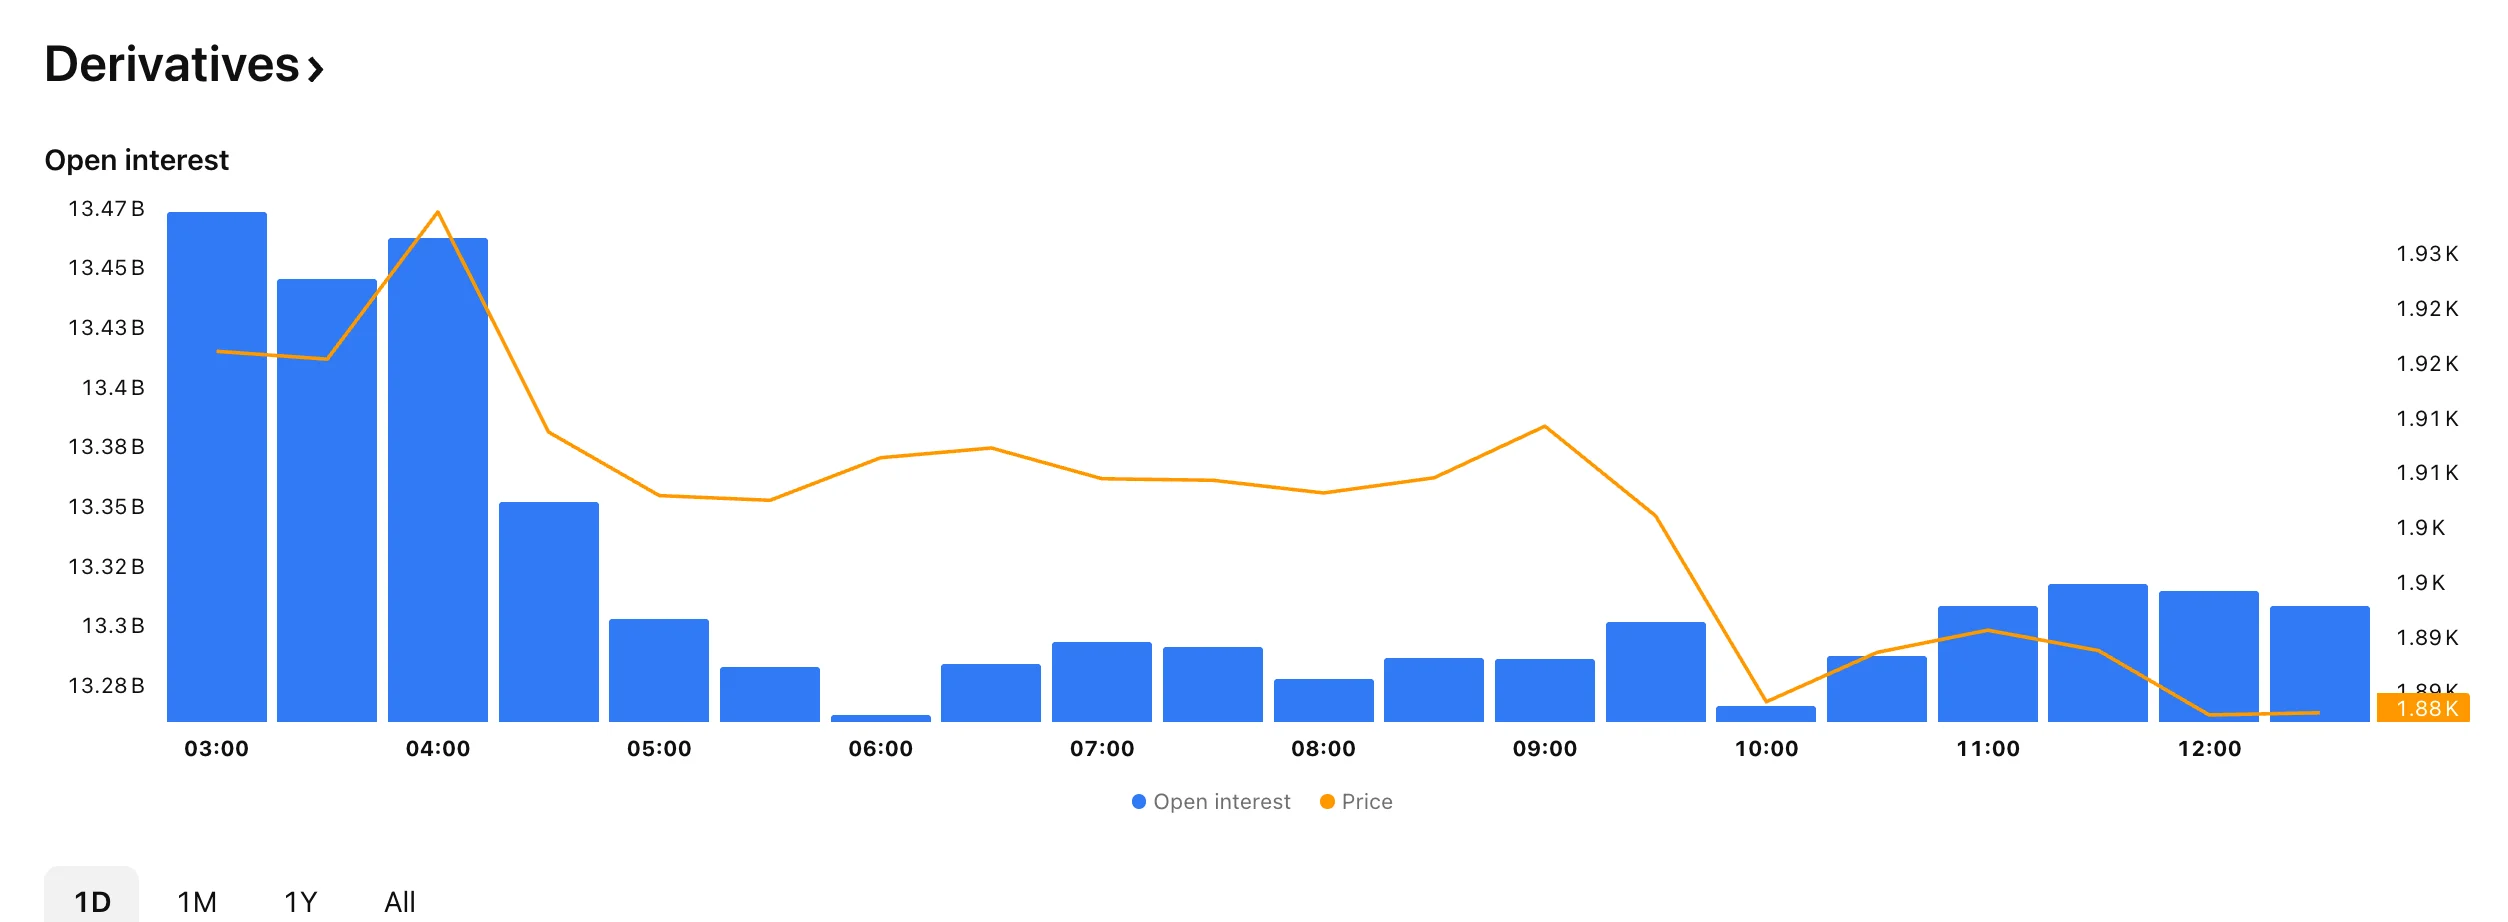
- Ethereum open interest declined from approximately $13.47 billion to roughly $13.31 billion.
Ethereum’s upward momentum appears to be weakening following the failure of ETH to penetrate the $2,000 threshold. The digital asset climbed from around $1,520 during early July to approach $1,980 last week. This advance represented its strongest performance in several months.
The uptrend has decelerated as market participants observe a cautionary signal from the TD Sequential indicator. This identical technical tool generated a buy signal close to the July bottom before Ethereum mounted its recovery. The indicator has transitioned to a sell configuration while ETH remains positioned beneath important near-term thresholds.
TD Sequential Indicator Shifts to Sell Mode Following ETH Advance
Crypto market analyst Ali Martinez highlighted how the TD Sequential has accurately captured recent Ethereum trend changes. The technical tool displayed a buy configuration when ETH dropped near $1,520. Ethereum subsequently rallied strongly and approached the $2,000 resistance area.
Source: X

Martinez noted that the indicator has currently generated a sell signal. This development indicates that the recent bullish movement may be exhausting itself. Ethereum has struggled to maintain positions above $1,900, creating challenges for market bulls.
ETH Price Maintains Position Near Critical Support Zone
The ETH price hovered around $1,883 on the four-hour timeframe after sliding beneath its 20-period and 50-period exponential moving averages. The 20-period EMA registered near $1,904.89, while the 50-period EMA positioned itself close to $1,900.10.
Ethereum stayed marginally above the 100-period EMA at $1,878.53. This threshold currently functions as a support foundation. Dropping below this marker could clear the path toward the 200-period EMA near $1,844.60.
Source: TradingView
The MACD displayed diminishing momentum. The MACD line remained beneath the signal line, while the histogram extended further into negative space. Market bulls require a recapture of the $1,900 to $1,905 zone to stabilize the near-term technical picture.
Market Observers Anticipate Potential Reversal
Crypto Lens noted that Ethereum has consolidated between $1,860 and $1,955 as distribution pressure constrains the rebound. The analyst anticipates ETH price will challenge $2,000 before a subsequent correction unfolds. The forecasted correction range extends between $1,400 and $900.
Crypto Rover examined the ETH/BTC pair. Ethereum has established a pattern of descending peaks and troughs against Bitcoin throughout the previous year. The pair bounced from approximately 0.025 in June to 0.03, yet continues trading beneath former highs.
Rover anticipates another rejection that may drive the pair below 0.0235. Such a movement would establish Ethereum at a new multi-year low versus Bitcoin and demonstrate ongoing underperformance compared to the dominant cryptocurrency.
Open Interest Contracts as Liquidation Activity Increases
Ethereum open interest decreased from approximately $13.47 billion to roughly $13.31 billion over the preceding day. The contraction revealed that market participants scaled back leveraged exposure as ETH approached $1,880. Open interest subsequently recovered modestly, though trading sentiment remained conservative.
Source: TradingView
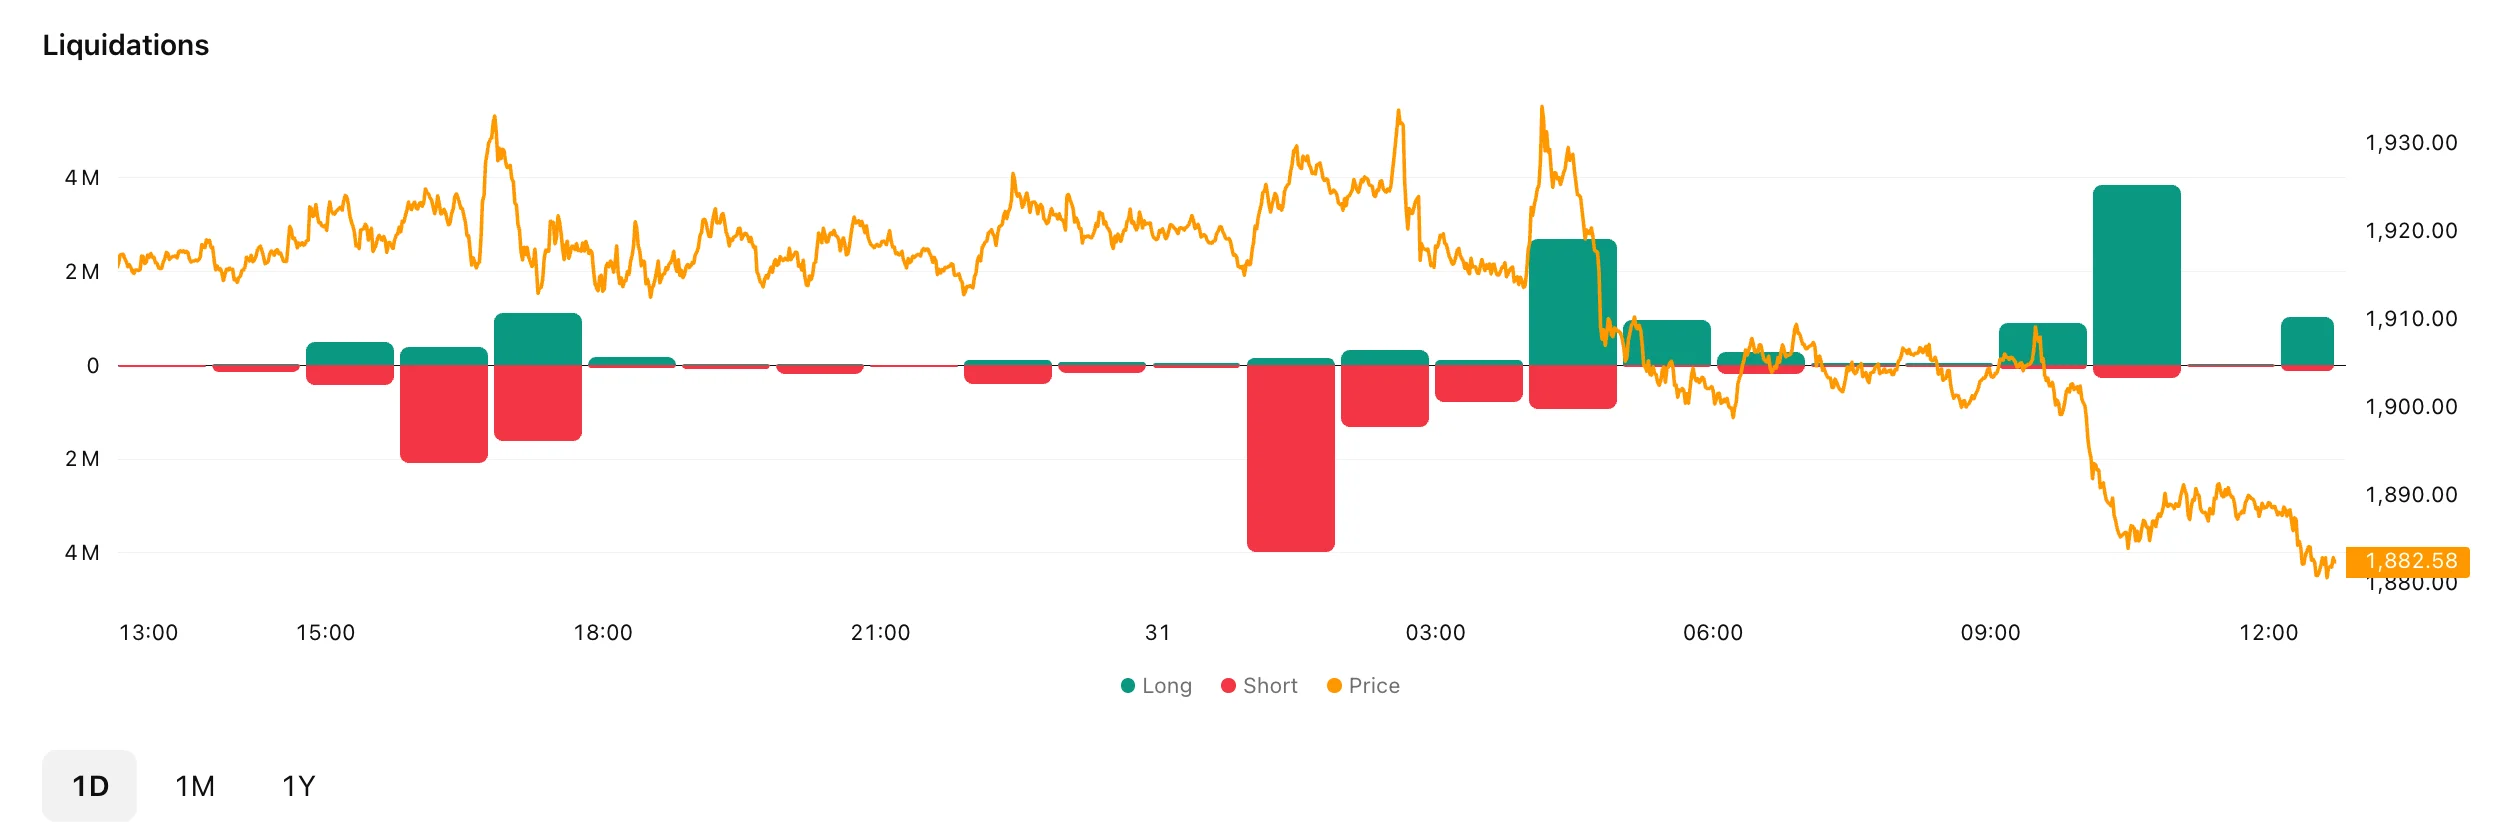
Liquidation statistics revealed losses across both market directions. Long position liquidations totaled approximately $3.8 million throughout the price descent. Short position liquidations also increased during temporary bounces, with one concentration approaching $4 million.
Source: TradingView
The statistics demonstrate that Ethereum continues operating within a delicate range. Support around $1,878 and resistance beyond $1,900 currently define the next potential movement. A decisive break from either boundary may determine the ETH price trajectory in subsequent trading sessions.
Get 3 Free Stock Ebooks
Discover top-performing stocks in AI, Crypto, and Technology with expert analysis.
- Top 10 AI Stocks - Leading AI companies
- Top 10 Crypto Stocks - Blockchain leaders
- Top 10 Tech Stocks - Tech giants



