
 Price Slips to $1.057 as Exchange Reserves Surge to 3-Month Peak")
Key Takeaways
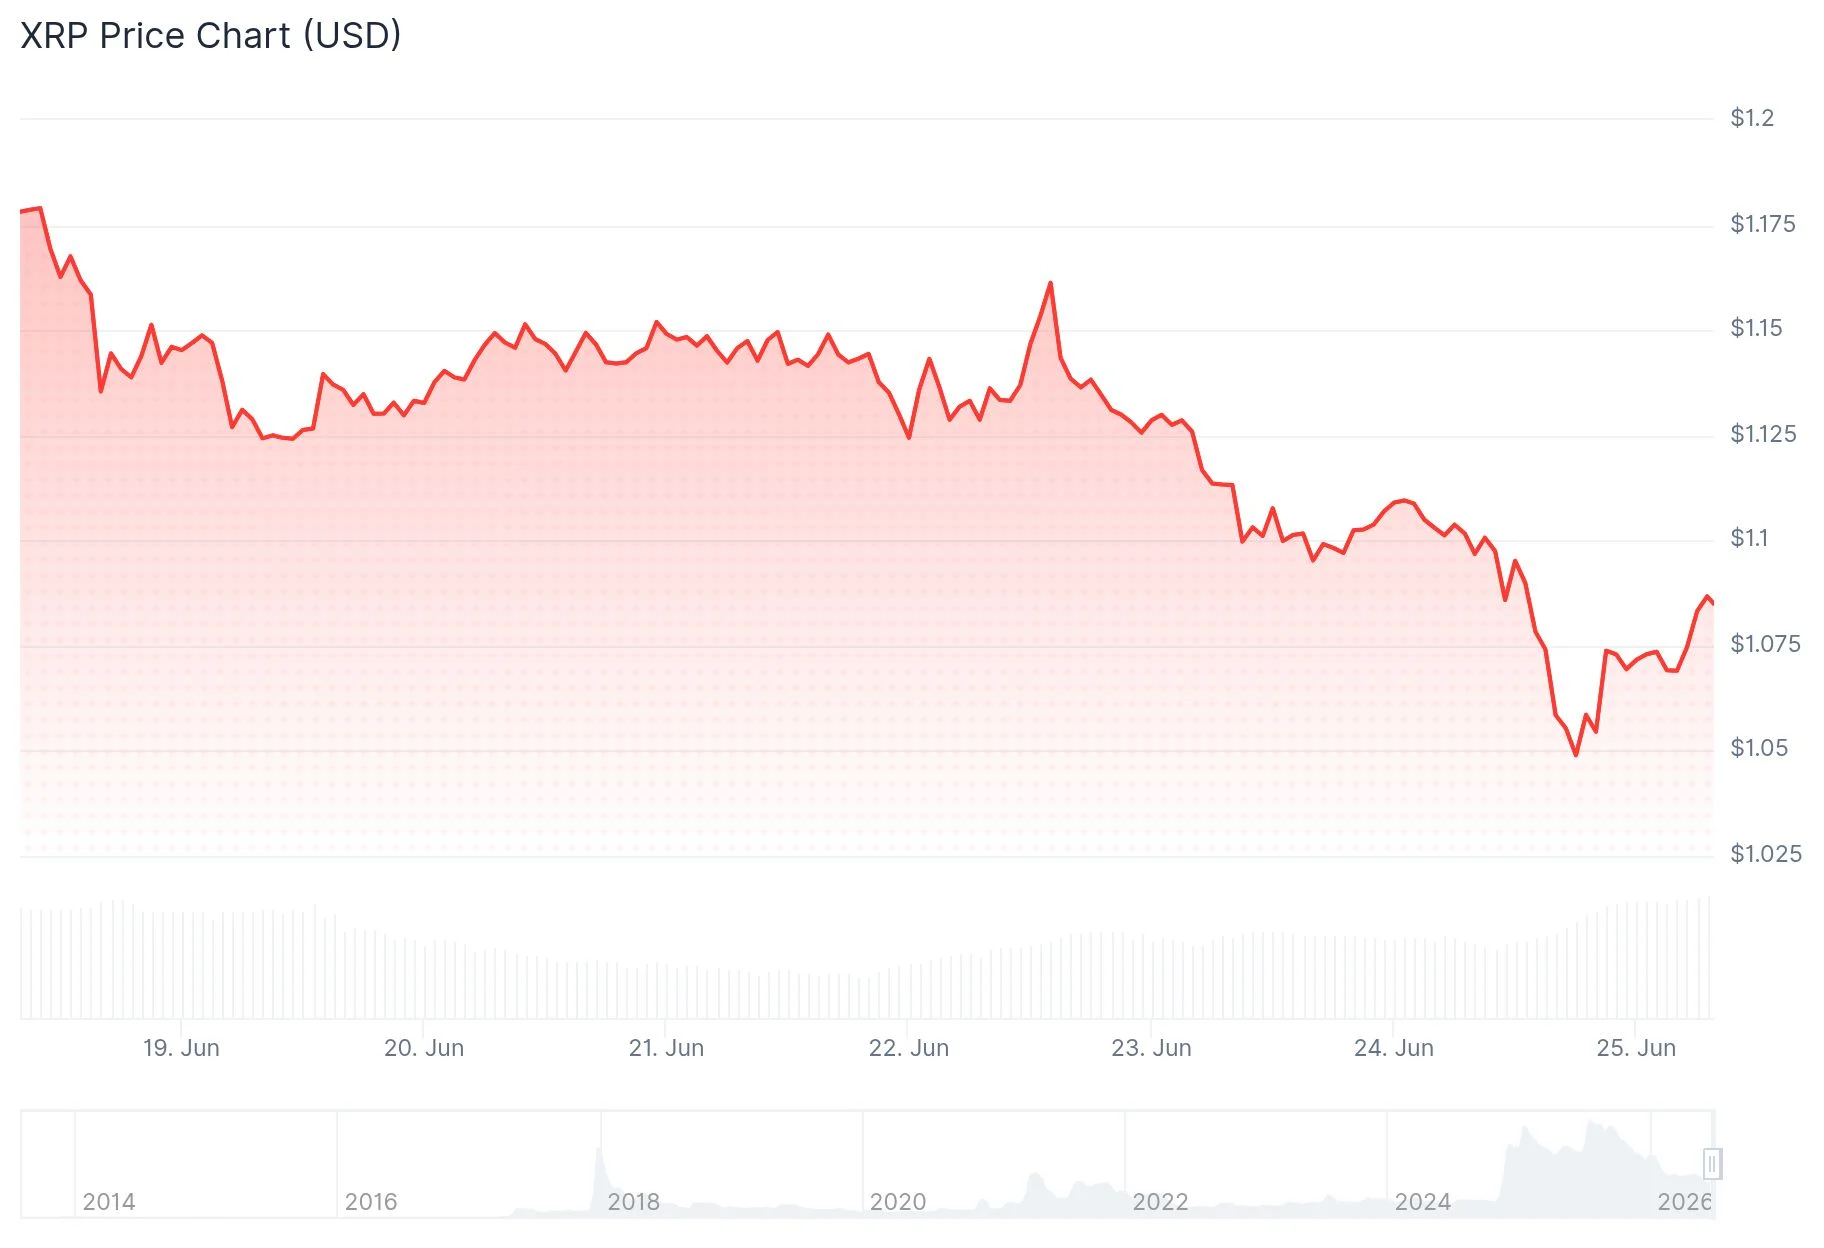
- XRP declined to approximately $1.057, representing a decrease exceeding 15% from its June 16 high around $1.29
- Binance XRP reserves reached a 3-month peak, pushing the Scarcity Index down to 0.34
- Technical charts reveal a falling wedge formation on the 4-hour timeframe, suggesting potential recovery prospects
- Data from CoinGlass indicates a significant liquidation zone near $1.14 that may attract upward price movement
- Over $13.53 million in XRP futures positions were liquidated across 24 hours, with 96% being long contracts
The digital asset XRP has experienced consistent downward pressure following its June 16 peak near $1.29. As of June 24, the token was changing hands around $1.057, marking a decline exceeding 15% within approximately eight days.
The downturn emerged shortly after Ripple obtained preliminary authorization under Europe’s Markets in Crypto-Assets (MiCA) regulatory framework via Luxembourg. Despite this approval granting passporting privileges throughout the European Economic Area, market participants leveraged the announcement as an exit opportunity rather than a catalyst for additional gains.
Bitcoin’s performance compounded the negative pressure. The leading cryptocurrency temporarily dipped beneath $62,000 during this timeframe, dampening enthusiasm throughout the wider digital asset ecosystem. Sustained elevated interest rates combined with capital migration toward artificial intelligence and semiconductor equities have constrained speculative investment flows into cryptocurrencies during Q2.
Cryptocurrency analyst Altcoin Sherpa shared commentary on X, noting that chart structures appear unfavorable across multiple timeframes and suggesting XRP might gradually decline toward $0.75. Such pessimistic projections from prominent market observers underscore the prevailing cautious sentiment.
Falling Wedge Formation Maintains Reversal Potential
The 4-hour price chart displays XRP developing a falling wedge configuration since the June 16 peak. This technical structure consists of two descending trendlines that converge and frequently signals a bullish reversal when downward momentum exhausts.

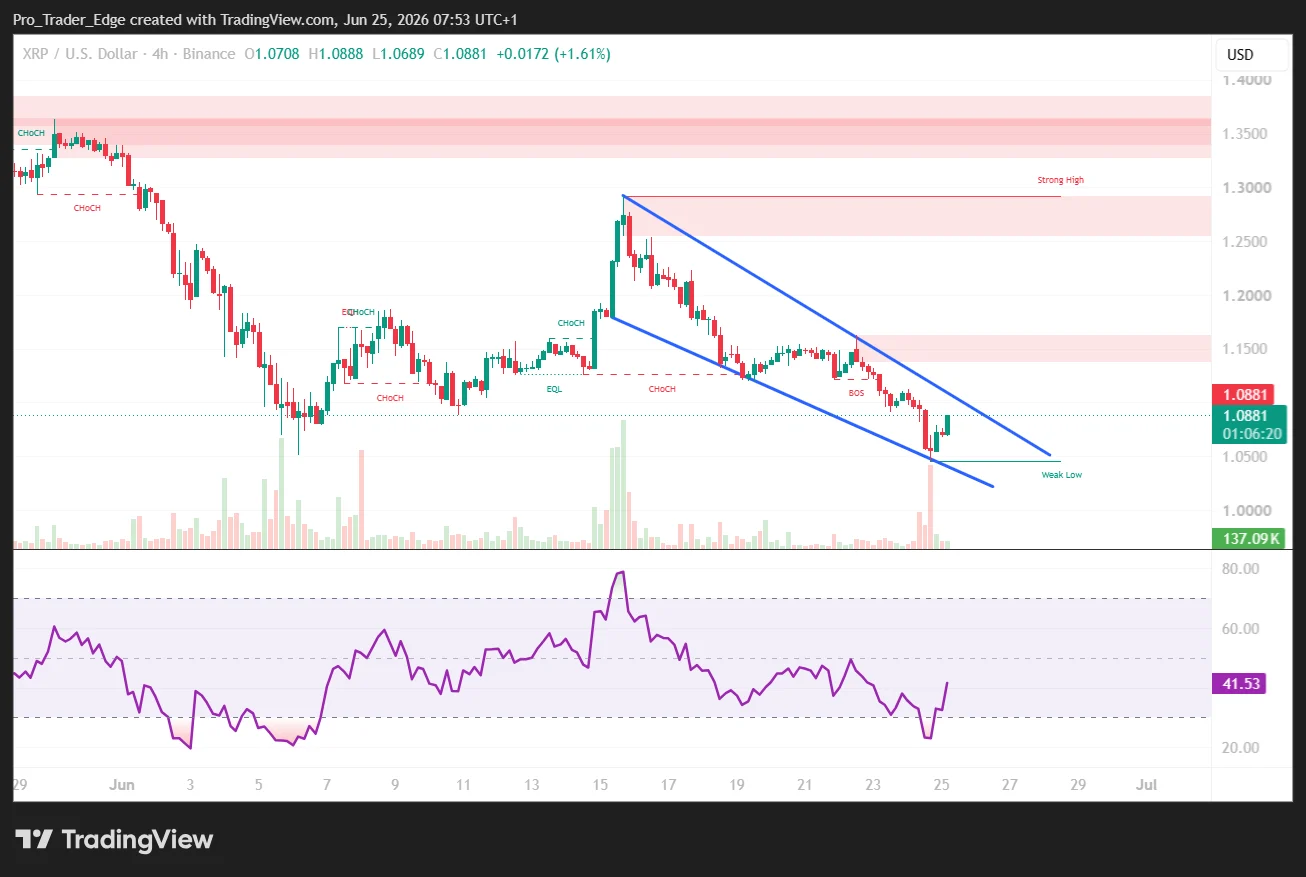
The price has tested the wedge’s lower boundary around $1.08, which coincides with a Fibonacci support area. A successful breach above the upper trendline could expose resistance zones at $1.13, $1.16, and $1.19.
Technical momentum signals present a mixed picture. The 4-hour MACD indicator remains in negative territory, confirming sellers maintain short-term dominance. Nevertheless, the histogram bars have begun consolidating, hinting that bearish momentum might be weakening. The Chaikin Money Flow indicator registers approximately -0.13, reflecting continued capital outflows.
Examining the daily timeframe, XRP trades beneath Supertrend resistance positioned near $1.24 and within a pattern of declining peaks since mid-May. The daily RSI hovers around 36, nearing oversold conditions without reaching that threshold.
Exchange Inventory Expands as Scarcity Metric Reaches Multi-Month Low
A Cryptoquant report released June 22 reveals the XRP Binance Scarcity Index descended to approximately 0.34, representing its lowest reading in over three months. This metric evaluates available XRP inventory on Binance relative to trading activity.
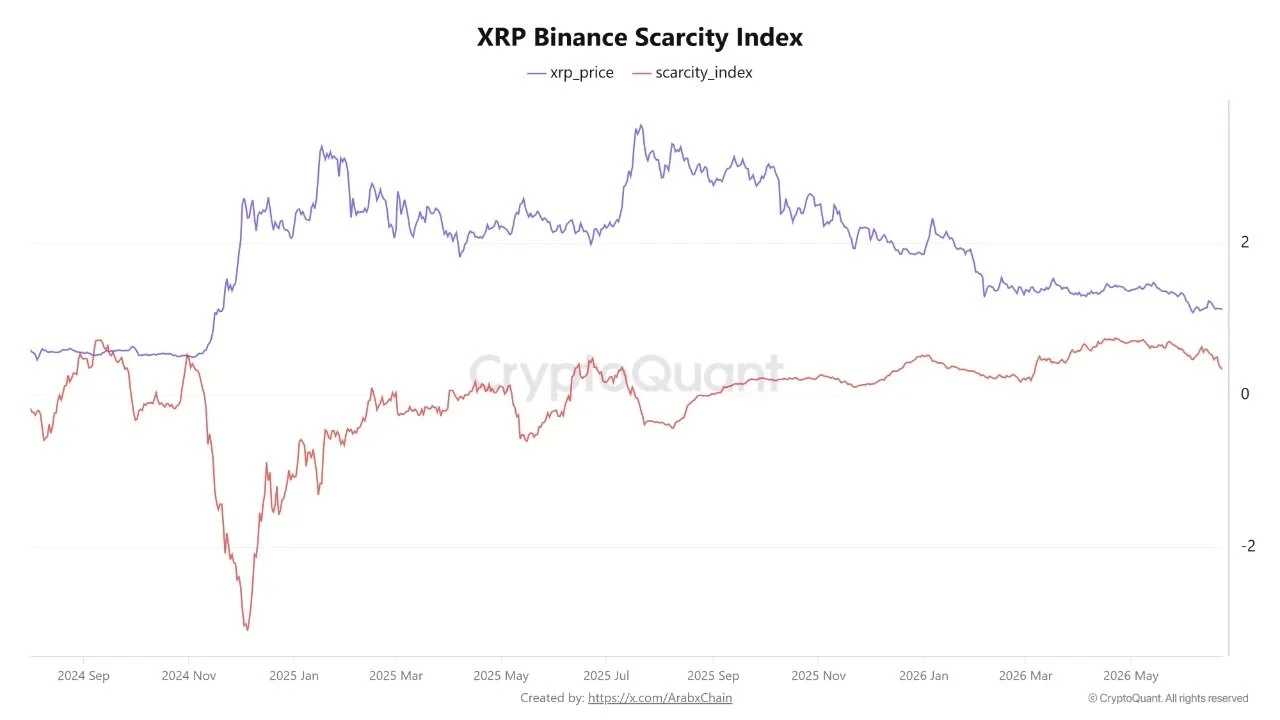
Throughout April and May, the index maintained levels near 0.80, indicating constrained supply conditions. The decline to 0.34 signals increased XRP availability on the platform, which typically restricts upward price momentum absent corresponding demand growth.
CoinGlass statistics highlight a substantial liquidation concentration between $1.13 and $1.15. Should buying interest emerge at present support levels, that zone could magnetize price activity and trigger short position liquidations. During the preceding 24-hour period, $13.53 million worth of XRP derivative contracts faced liquidation, with long positions accounting for $13.01 million, representing 96% of total liquidations. Binance dominated with $7.59 million in forced closures, trailed by Bybit at $2.57 million.
A breakdown beneath $1.08 would shift attention toward $1.05 and subsequently $1.00 as prospective support thresholds.
Get 3 Free Stock Ebooks
Discover top-performing stocks in AI, Crypto, and Technology with expert analysis.
- Top 10 AI Stocks - Leading AI companies
- Top 10 Crypto Stocks - Blockchain leaders
- Top 10 Tech Stocks - Tech giants


