
 Bounces Back: Why Analysts View Recent Market Flush as a Strategic Reset Before $1.30 Rally")
Key Takeaways
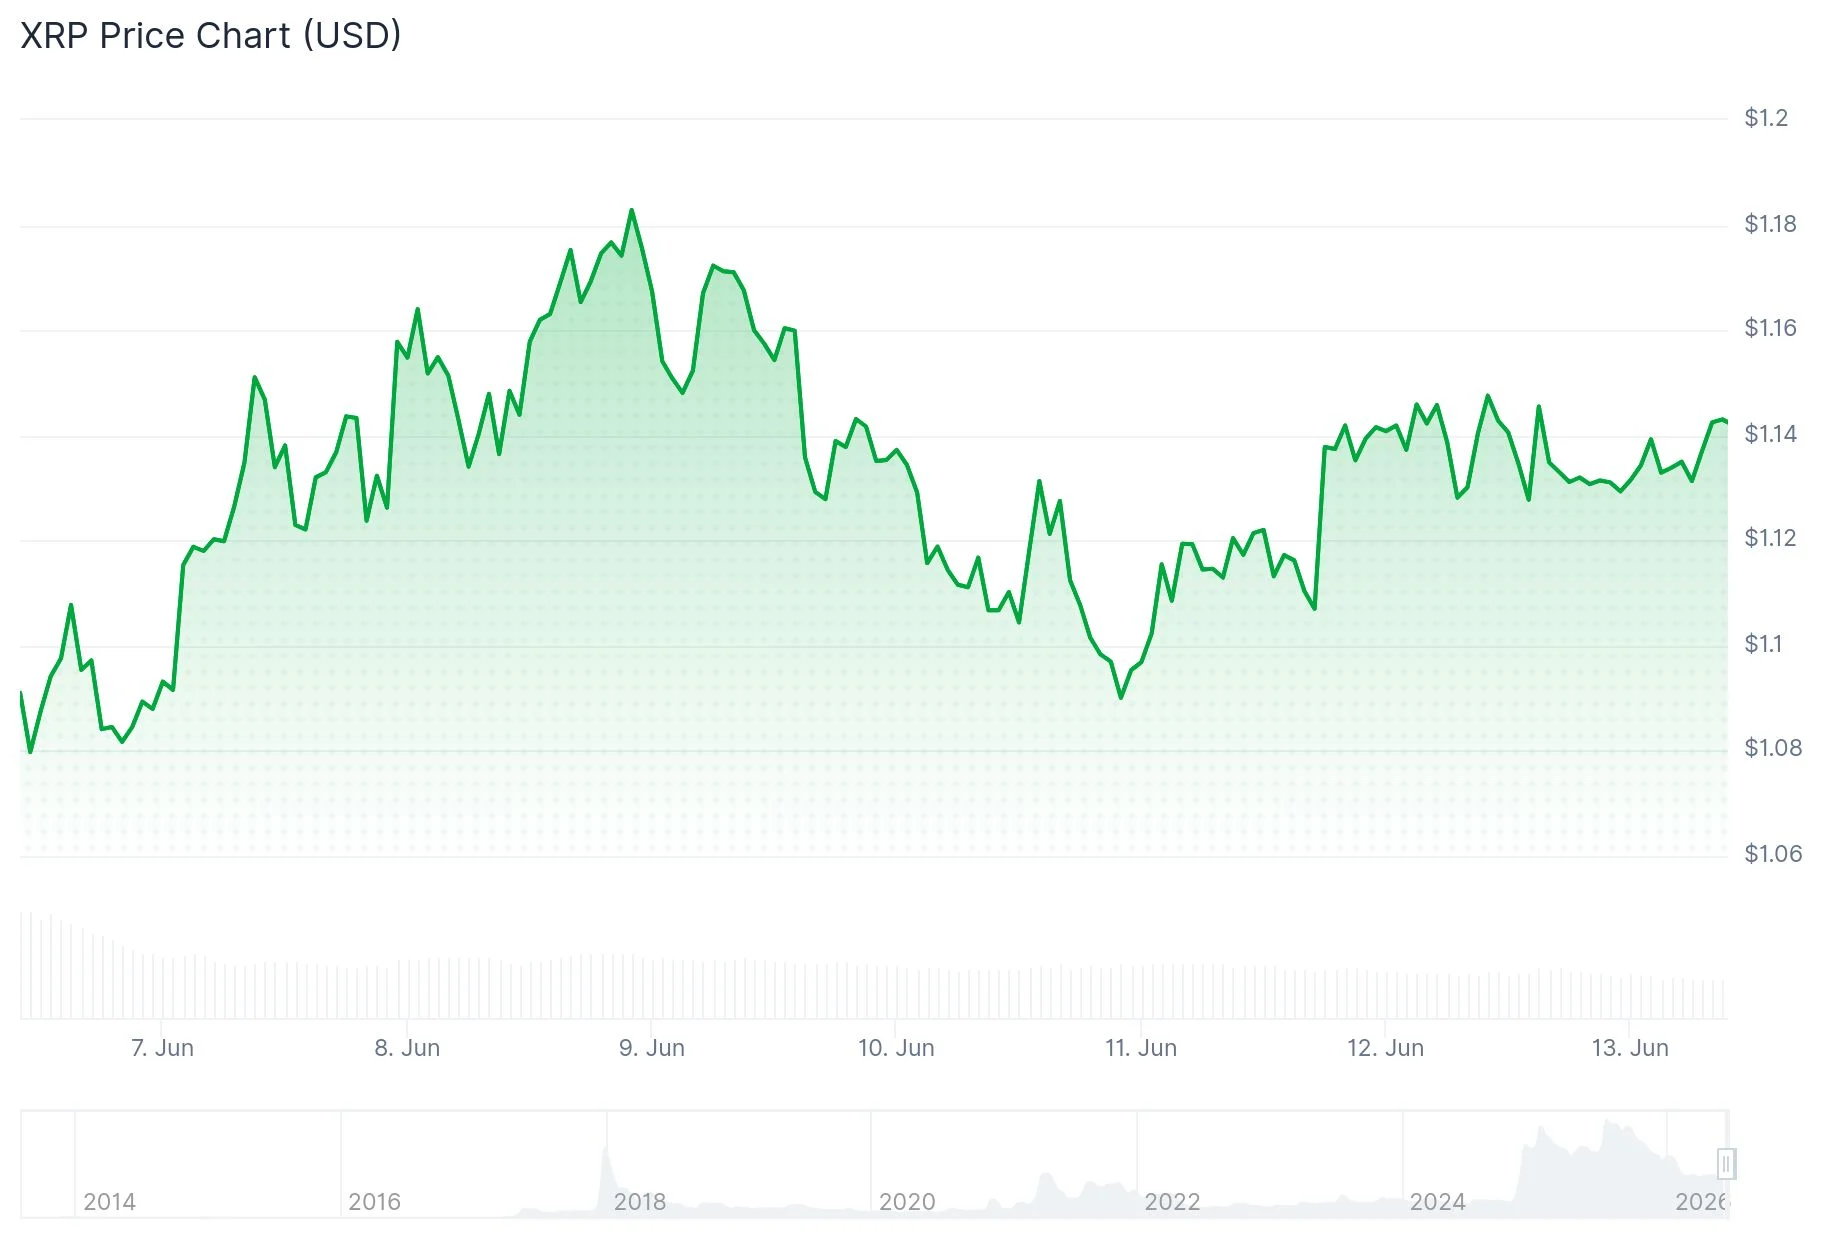
- XRP maintains stability above $1.14 following a brief decline to $1.05 during the latest market pullback
- Technical analysts identify a bullish RSI divergence pattern, pointing to potential momentum toward $1.30
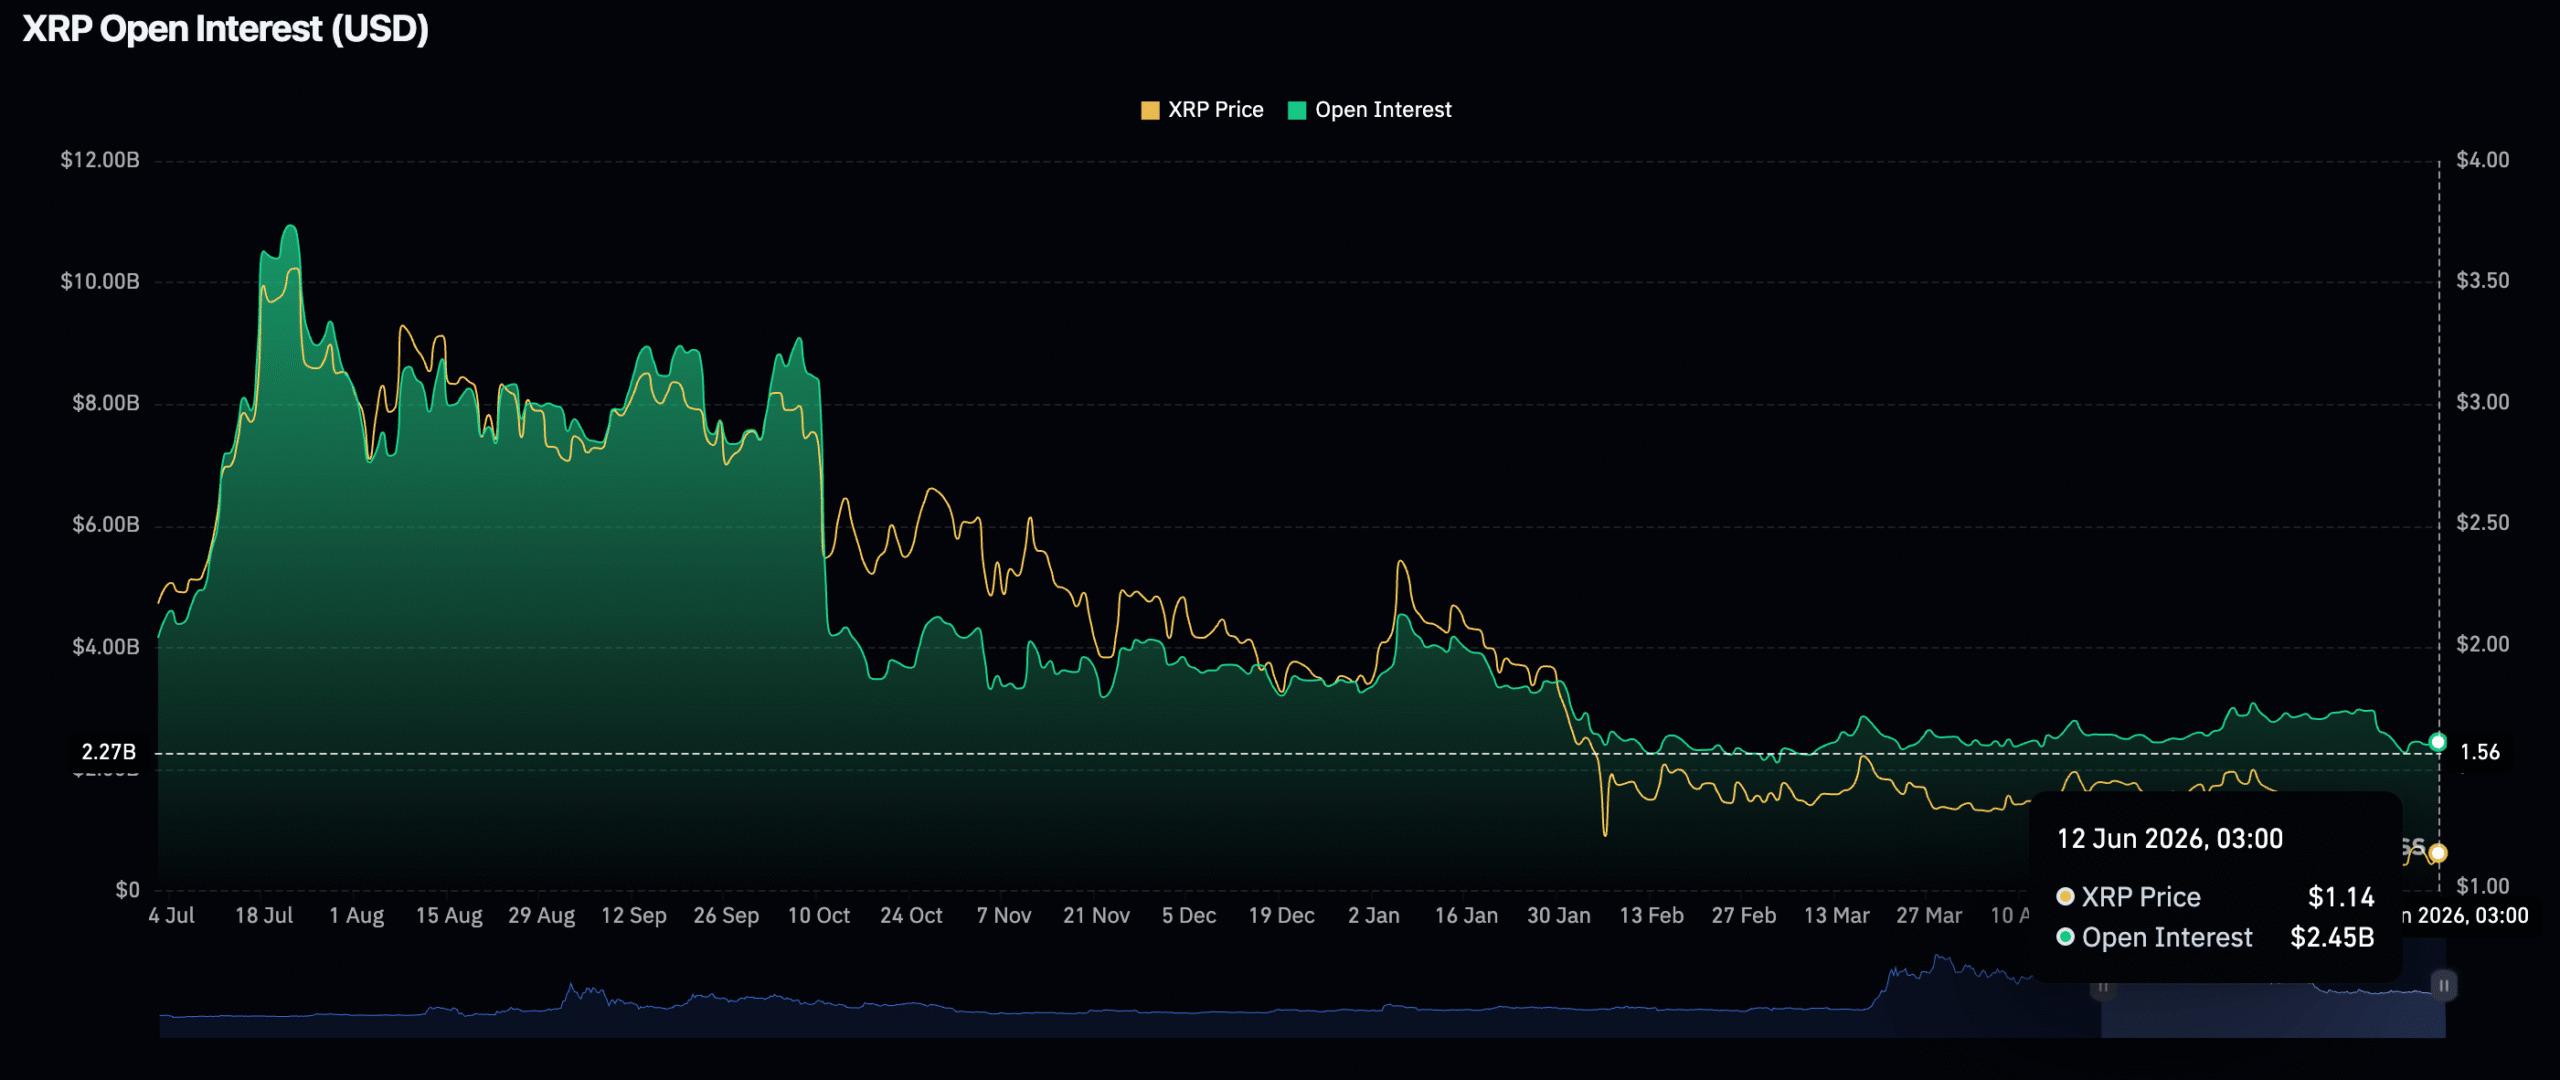
- Derivatives market activity has cooled, with Futures Open Interest falling from $2.96 billion to $2.45 billion in June
- XRP ETF activity remains inconsistent, recording zero inflows on Thursday despite cumulative totals reaching $1.43 billion
- Price action remains constrained below major moving averages, with the 50-day EMA at $1.30 serving as immediate overhead resistance
Ripple’s XRP cryptocurrency is currently changing hands near $1.14 following a rebound from June’s floor of $1.05. The downward move cleared out stop-loss orders and eliminated highly leveraged positions before market participants returned to accumulate.
CryptoPulse, a cryptocurrency market analyst, characterized the movement as a “capitulation flush,” noting that the sweep below the $1.13 support threshold represented a critical cleansing event required to establish a foundation for potential upside.
The subsequent bounce has highlighted an emerging technical formation on the Relative Strength Index indicator. Despite price action establishing a lower low, the RSI created a higher low — a bullish divergence signal that indicates diminishing downside momentum.
Futures Market and ETF Activity Show Signs of Cooling
Futures Open Interest recorded an average of $2.96 billion at the beginning of June but has contracted to $2.45 billion as of the latest data. This reduction reflects waning participation from speculators and suggests hesitation regarding immediate upward price movement.
XRP spot exchange-traded fund flows have demonstrated volatility. Tuesday recorded $7.44 million in inflows, followed by $1.2 million on Wednesday, but Thursday registered no activity whatsoever. Total cumulative ETF inflows have reached $1.43 billion, while assets under management currently sit at $985 million.

ChartNerd, another technical analyst, highlighted a significant pattern on the two-week timeframe. Price has retreated to the lower regression band of the Gaussian Channel around $1.04, a zone that has historically marked similar junctures during previous market cycles. ChartNerd referred to this area as “the land of macro opportunity” and noted its consistent appearance during comparable phases.
Critical Moving Average Levels Present Overhead Obstacles
XRP continues to trade beneath its 10-day, 50-day, 100-day, and 200-day exponential moving averages. The 50-day EMA hovers around $1.30, coinciding precisely with the resistance threshold that market watchers are monitoring closely.
The 100-day EMA is positioned near $1.39, with the 200-day EMA located around $1.61. These technical markers create a substantial resistance corridor that must be penetrated for any meaningful bullish continuation.
The RSI (14) currently registers at 35.10, hovering just above oversold conditions but moving closer to that threshold. The MACD indicator maintains a marginally negative reading at -0.06656. Meanwhile, the Momentum (10) indicator has generated a Buy signal, potentially signaling that near-term selling pressure is exhausting itself.
TradingView technical data presents an overall Neutral rating, comprising 14 Sell indicators, 10 Neutral readings, and only 2 Buy signals.
An Elliott Wave interpretation suggests XRP could be finalizing a Wave (2) corrective sequence within a broader Cycle Wave V pattern. The projected accumulation territory spans from the 50% to 61.8% Fibonacci retracement levels, approximately $1.19 down to $0.91. Technical strategists assign a 65-70% likelihood that the overarching bullish framework remains valid.
XRP was last quoted at approximately $1.14, representing a 3.06% gain over the preceding 24-hour period at the time of publication.
Get 3 Free Stock Ebooks
Discover top-performing stocks in AI, Crypto, and Technology with expert analysis.
- Top 10 AI Stocks - Leading AI companies
- Top 10 Crypto Stocks - Blockchain leaders
- Top 10 Tech Stocks - Tech giants


