
 Price Analysis: Critical Support Zone Tests Bulls’ Resolve")
Key Takeaways
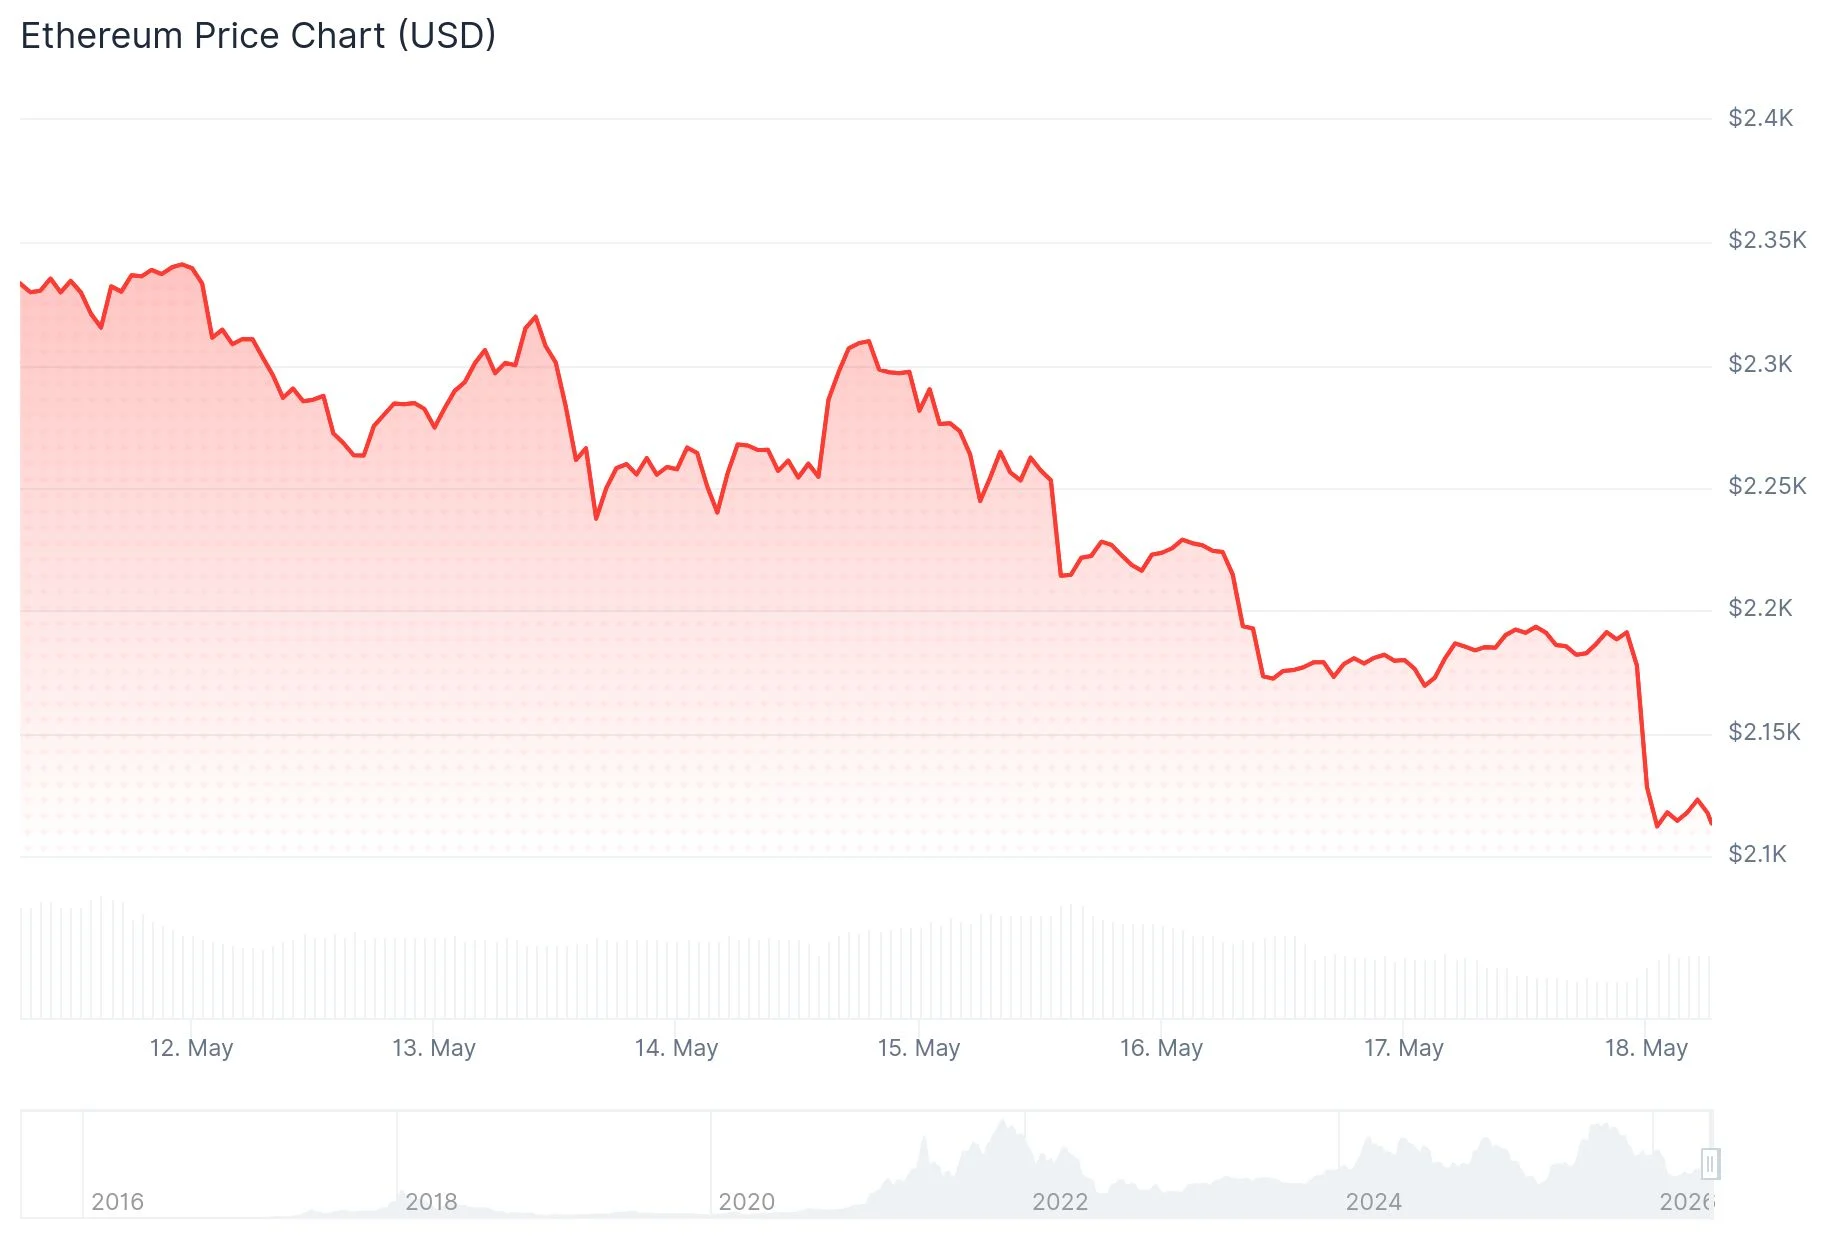
- ETH price hovers between $2,184–$2,188, with critical support zones at $2,170 and $2,122
- Daily chart indicators show RSI at 39.57 with bearish MACD readings indicating subdued buying momentum
- Unfilled CME gap around $2,680 presents potential upside scenario; approximately $11B in short positions face liquidation risk
- Companies now hold 7.33 million ETH valued at approximately $16 billion, representing about 6% of circulating supply
- Price must break through $2,300–$2,501 resistance before targeting the $2,680 level becomes viable
As of May 18, 2026, Ethereum hovers around $2,185, positioned at a crucial juncture on its daily price chart. Market participants are attempting to defend the lower boundary of an established trading channel amid mounting technical pressure signals.
Technical indicators reveal concerning momentum trends. The Relative Strength Index registers 39.57, falling beneath the neutral threshold of 50, which signals diminished buying activity. Meanwhile, the MACD configuration shows the main line at -20.2 against a signal line of -15.8, accompanied by negative histogram readings that confirm sustained bearish momentum.
Market analyst More Crypto Online emphasized that current price action doesn’t mirror characteristics of complete capitulation or a definitive market peak. According to their assessment, the retracement maintains corrective characteristics provided ETH successfully defends the lower channel boundary.
Cryptorphic, another market observer, highlighted that momentum deteriorated following rejection from upper resistance territory. The breach below immediate support levels demonstrated that bulls were surrendering short-term control.
Critical Price Levels Under Watch
Immediate support zones are established at $2,170 and $2,122. Should these defensive levels collapse, attention shifts to the $2,037 region as the subsequent significant area of potential price stabilization.

Regarding upward movement, ETH must successfully breach $2,318 to enhance its technical positioning. Beyond that threshold, $2,501 represents the primary Fibonacci-based resistance barrier, and clearing it decisively would establish a trajectory toward the $2,680 target.
Analyst Max Crypto drew attention to an unfilled CME futures gap positioned near $2,680. These gaps frequently act as price magnets when market momentum shifts favorably. Max further highlighted that roughly $11 billion worth of short positions could face forced liquidation should ETH reach that elevation, potentially accelerating upward price velocity.
Institutional Holdings Reach $16 Billion Milestone
Market commentator Crypto Patel referenced CoinGlass analytics revealing that corporations maintaining strategic Ethereum positions now control 7.33 million ETH, valued at approximately $16 billion. This volume accounts for roughly 6% of Ethereum’s total token supply residing within corporate treasuries.
Patel interpreted this data as evidence of expanding institutional accumulation patterns. As a greater proportion of ETH becomes locked in long-duration corporate holdings, the actively traded supply contracts accordingly.
Analyst Ted Pillows observed that Ethereum reached the $2,150 support region as his analysis had anticipated, suggesting a potential rebound could materialize if this zone maintains integrity.
A broader timeframe analysis from Sangita_Gems identified ETH trading within a falling wedge pattern that resembles a prior recovery sequence. This formation suggests a theoretical advance toward $7,000 if ETH achieves a successful breakout and subsequent range retest.
Currently, ETH remains confined within its established channel structure, with $2,100 marking the lower trendline support and $2,501 defining the upper resistance objective.
Get 3 Free Stock Ebooks
Discover top-performing stocks in AI, Crypto, and Technology with expert analysis.
- Top 10 AI Stocks - Leading AI companies
- Top 10 Crypto Stocks - Blockchain leaders
- Top 10 Tech Stocks - Tech giants


