


Key Takeaways
- The company recorded a net loss of $12.5 million, a dramatic shift from the $11.4 million profit reported in the prior-year quarter
- Total revenue declined 2.4% to $544.1 million, falling short of the $556.8 million analyst consensus
- Entertainment segment revenue plummeted nearly 9% to $332.6 million
- Shares tumbled 12% to $7.38 during Monday’s after-hours session
- Comparable store sales decreased 2.9%, though this beat expectations of a 3.4% decline
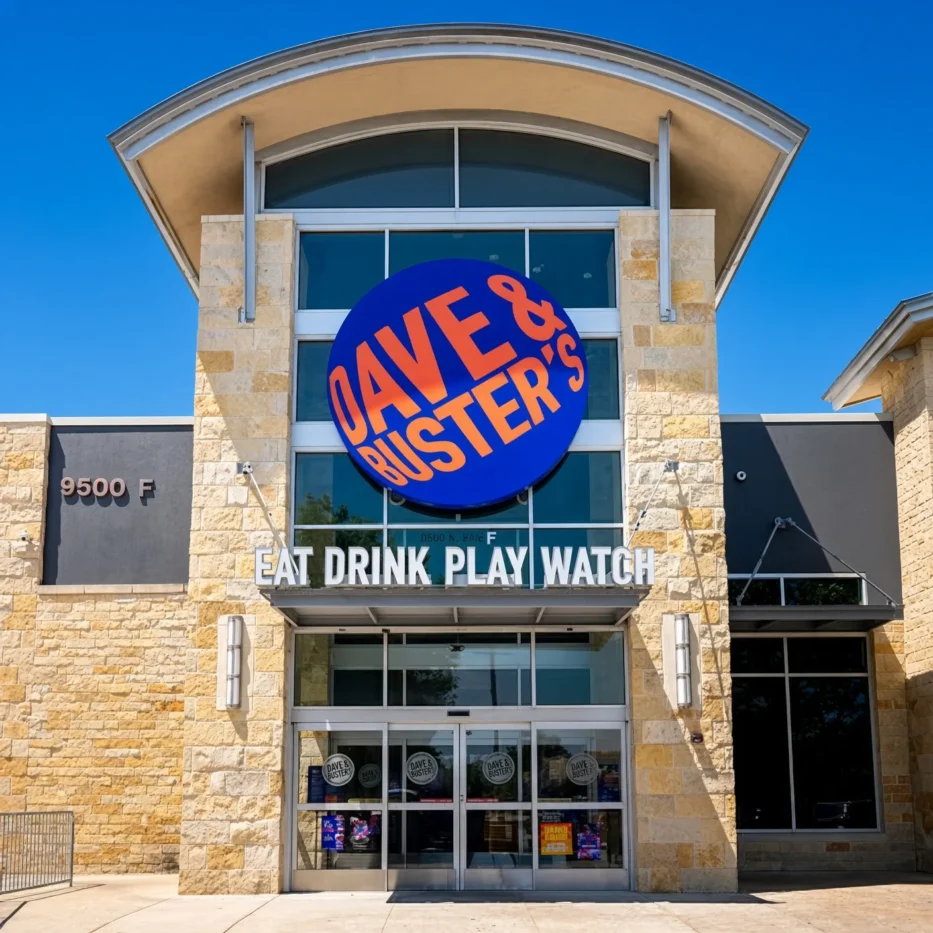
Dave & Buster’s Entertainment delivered disappointing second-quarter results, posting a net loss of $12.5 million, or $0.36 per diluted share. This marks a significant reversal from the $11.4 million profit, or $0.32 per diluted share, achieved during the comparable quarter last year. Shares plummeted 12% to $7.38 during Monday’s after-hours trading session.
Dave & Buster’s Entertainment, Inc., PLAY
Total revenue reached $544.1 million, representing a 2.4% year-over-year decrease and missing the analyst consensus estimate of $556.8 million. The adjusted loss per share of $0.27 significantly underperformed Wall Street’s expectation of $0.18 in earnings per share.
The entertainment segment proved to be the primary weakness, declining nearly 9% to $332.6 million. This marks approximately the eighth consecutive quarter where the company has experienced year-over-year declines in its entertainment operations.
Food and beverage operations provided one of the few positive highlights, with comparable sales increasing 7.6% for the fifth quarter in a row. Special-events revenue also maintained growth momentum for the seventh consecutive quarter.

Overall comparable store sales decreased 2.9%, though this actually surpassed analyst projections of a 3.4% decline. Performance showed sequential improvement heading into July, with same-store sales down only 1.6%, a notable improvement from June’s 5% decrease.
Strategic Reset Under New Leadership
Newly appointed CEO Darin Harper, who assumed leadership last month, is implementing what he describes as a “back-to-basics” approach. This strategy emphasizes occasions, value proposition, and operational consistency across the store footprint.
During the earnings conference call, Harper admitted that while the brand enjoys strong recognition, it hasn’t become the preferred destination for customers planning entertainment outings. “Our value and execution have not been dependable enough,” he stated candidly.
The entertainment chain has introduced 10 new games and attractions year-to-date, featuring popular intellectual properties including The Mandalorian, John Wick, and Stranger Things. Management reports that streamlined game pricing has driven a 16% to 20% improvement in both gameplay frequency and customer dwell time.
Dave & Buster’s has also assembled a new executive team, appointing fresh leadership for marketing, operations, technology, and legal functions. Notably, the marketing position had remained vacant for more than a year.
Financial Discipline and Efficiency Measures
Adjusted free cash flow improved significantly, turning positive at $19.5 million through the second quarter, contrasting sharply with negative $36.5 million during the same period one year earlier.
The management team has identified $15 million in cost savings anticipated over the coming 12 months, with potential opportunities to potentially double that figure. Net capital expenditures decreased to $127.6 million from $155.4 million in the prior year.
Looking ahead, the company intends to maintain fiscal 2026 capital spending below the $200 million threshold. As of quarter end, the company operated 250 company-owned locations, consisting of 184 Dave & Buster’s venues and 66 Main Event facilities.
Expansion plans include opening four additional domestic locations in the second half of fiscal 2026, followed by five more in fiscal 2027. The company completed six remodeling projects in fiscal 2026, with two additional renovations scheduled.
Harper expressed optimism about near-term improvements in comparable store sales, revenue, and EBITDA, while acknowledging that significant work remains to address traffic generation, affordability perception, and service consistency challenges.
Get 3 Free Stock Ebooks
Discover top-performing stocks in AI, Crypto, and Technology with expert analysis.
- Top 10 AI Stocks - Leading AI companies
- Top 10 Crypto Stocks - Blockchain leaders
- Top 10 Tech Stocks - Tech giants



