



Key Points
- Ethereum currently trading around $2,617 following a dip beneath the $2,600 threshold
- Sepolia testnet successfully activated the Glamsterdam upgrade this Tuesday
- Spot Ethereum ETFs experienced consecutive net outflows spanning six trading sessions, amounting to $207 million
- More than $400 million worth of long positions faced liquidation during a 20-minute window
- Market observers anticipate potential movement toward the $2,400–$2,600 zone before any push to $3,400
Ethereum (ETH) is currently hovering near $2,617 following a notable decline that pushed the digital asset below the $2,600 level. This downturn marks the end of a relatively stagnant period where the token remained confined between $2,650 and $2,750.
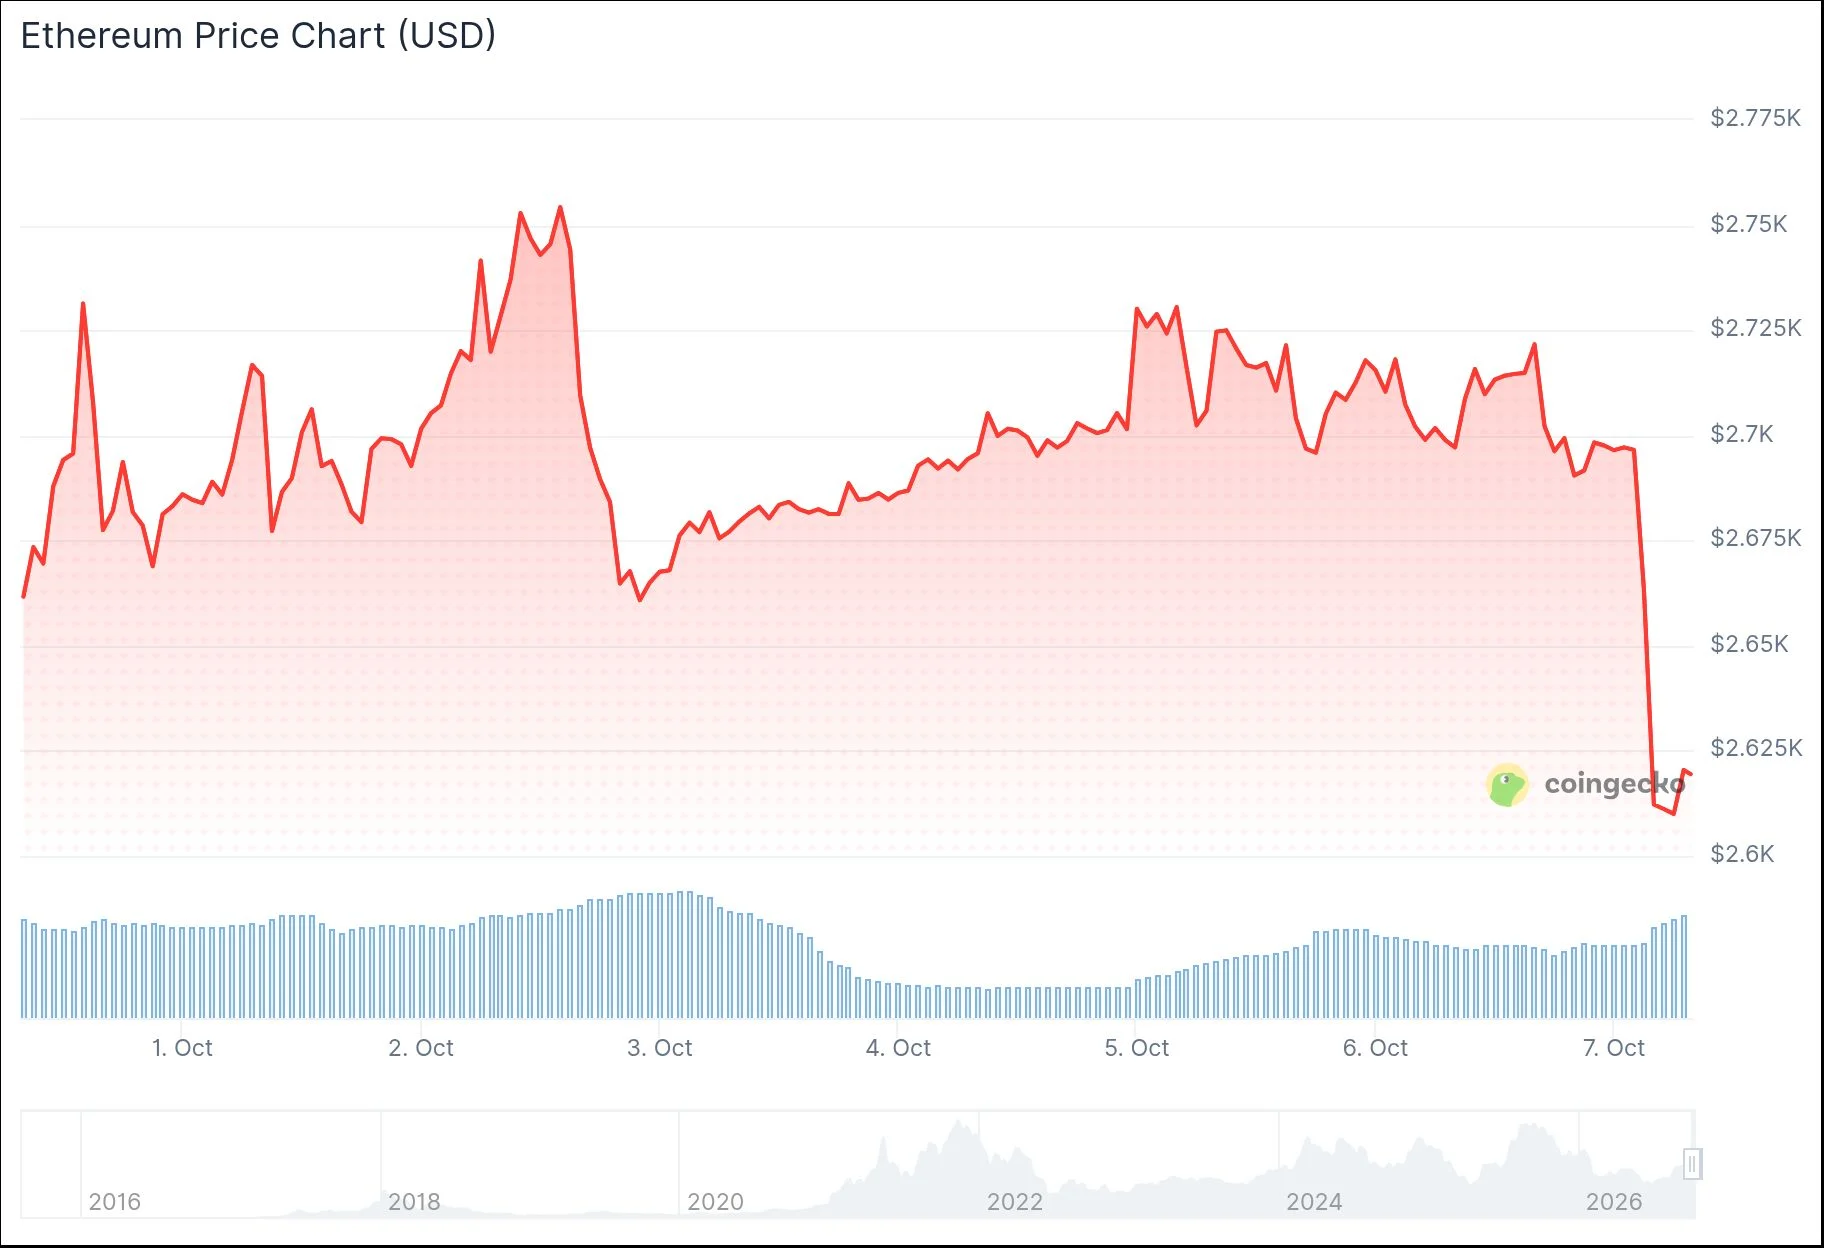
The decline occurred alongside the activation of Ethereum’s Glamsterdam upgrade on the Sepolia testnet this Tuesday. This deployment represents an important milestone before the protocol enhancement advances to the main network.
The Glamsterdam upgrade merges two distinct protocol enhancements—Amsterdam and Gloas—bringing together 18 primary proposals and 7 supplementary ones. These modifications address various aspects of block management and data processing throughout the network.
Among the most significant modifications is the expansion of the gas limit, which jumps from 60 million to 200 million. This adjustment enables the blockchain to accommodate higher transaction volumes and execute more complex computations within each block.
During Tuesday’s OKX NOW event, Ethereum co-founder Vitalik Buterin shared insights about the platform’s evolution. He indicated that onchain applications will increasingly incorporate AI capabilities throughout the coming two years, with automated systems managing a substantial portion of user-facing operations.

Market Movement and Forced Liquidations
The downward price movement sparked widespread forced closures throughout the cryptocurrency market. Analytics account Watcher.Guru reported that as ETH breached the $2,600 mark, approximately $400 million in leveraged long positions were forcibly closed within a mere 20-minute timeframe.
According to Coinglass analytics, ETH experienced $15.3 million in liquidations across a 24-hour span, with long positions accounting for $10.5 million of that total. When examining the daily chart, ETH maintains its position above the 20-, 50-, and 100-day moving averages, suggesting persistent buying interest despite recent weakness.
Key resistance zones are positioned around $2,781, with additional barriers at $3,075 and $3,260. Critical support is found at the 20-day moving average near $2,656, followed by $2,631, $2,558, and the 50-day moving average at $2,500.
Investment Fund Withdrawals and Network Metrics
Spot Ethereum exchange-traded funds have registered six consecutive sessions of net withdrawals. Market participants removed $207 million from these investment vehicles across five trading days, marking the most extended withdrawal period since June.
These withdrawals come on the heels of ETH’s September rally from $2,400 to $2,800. The redemption pattern indicates some early participants are realizing gains.
Nevertheless, Ethereum’s MVRV Ratio has increased from 1.4% to 3.5% during this same window. This indicator measures the relationship between market value and realized value for holders and continues to show positive readings.
Market analysts have drawn parallels between current conditions and the April-May 2025 period, when ETH found a bottom around $1,400 before surging to record highs following the Pectra upgrade. They suggest a comparable trajectory might emerge if support at $2,400 remains intact.
The Relative Strength Index for ETH remains positioned above the 50 threshold, indicating bullish momentum that could facilitate advancement toward $3,400 should demand strengthen. At 06:37 UTC on October 7, ETH was trading at $2,617.71, representing a 2.98% daily decline.
Get 3 Free Stock Ebooks
Discover top-performing stocks in AI, Crypto, and Technology with expert analysis.
- Top 10 AI Stocks - Leading AI companies
- Top 10 Crypto Stocks - Blockchain leaders
- Top 10 Tech Stocks - Tech giants



