
 Breaks Below Key Support—Analysts Now Eye $53 Price Target")
Key Takeaways
- SOL currently trades at $69.53, representing a 6% decline over 24 hours and a 42% loss year-to-date.
- A crucial support zone at $77 has been breached, prompting analyst Ali Martinez to identify $53 as the next significant downside level.
- All primary exponential moving averages (20, 50, 100, and 200-day EMAs) are now above current price, signaling widespread bearish momentum.
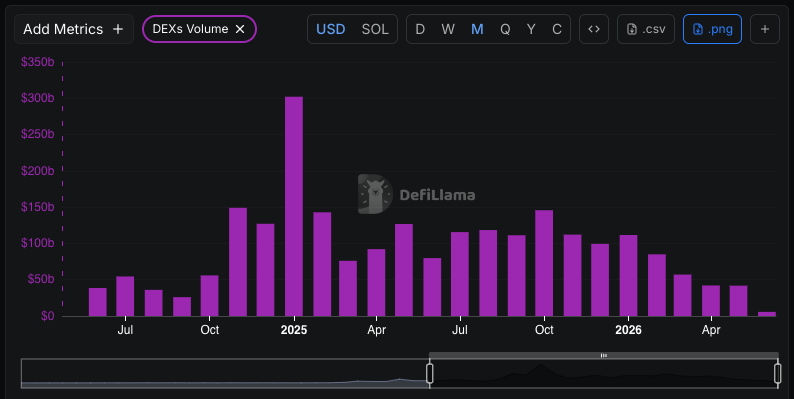
- Monthly decentralized exchange volumes on Solana have plummeted 62% since January, declining from $111 billion to $42 billion.
- After breaking down from a 5-month trading range between $77 and $97, technical analysis suggests a potential move toward $50.
Solana continues its downward trajectory following a decisive break beneath a pivotal support level that market participants had been monitoring for months. Currently, SOL is changing hands at $69.53, accompanied by $8.31 billion in 24-hour trading volume and maintaining a market capitalization of $40.22 billion.
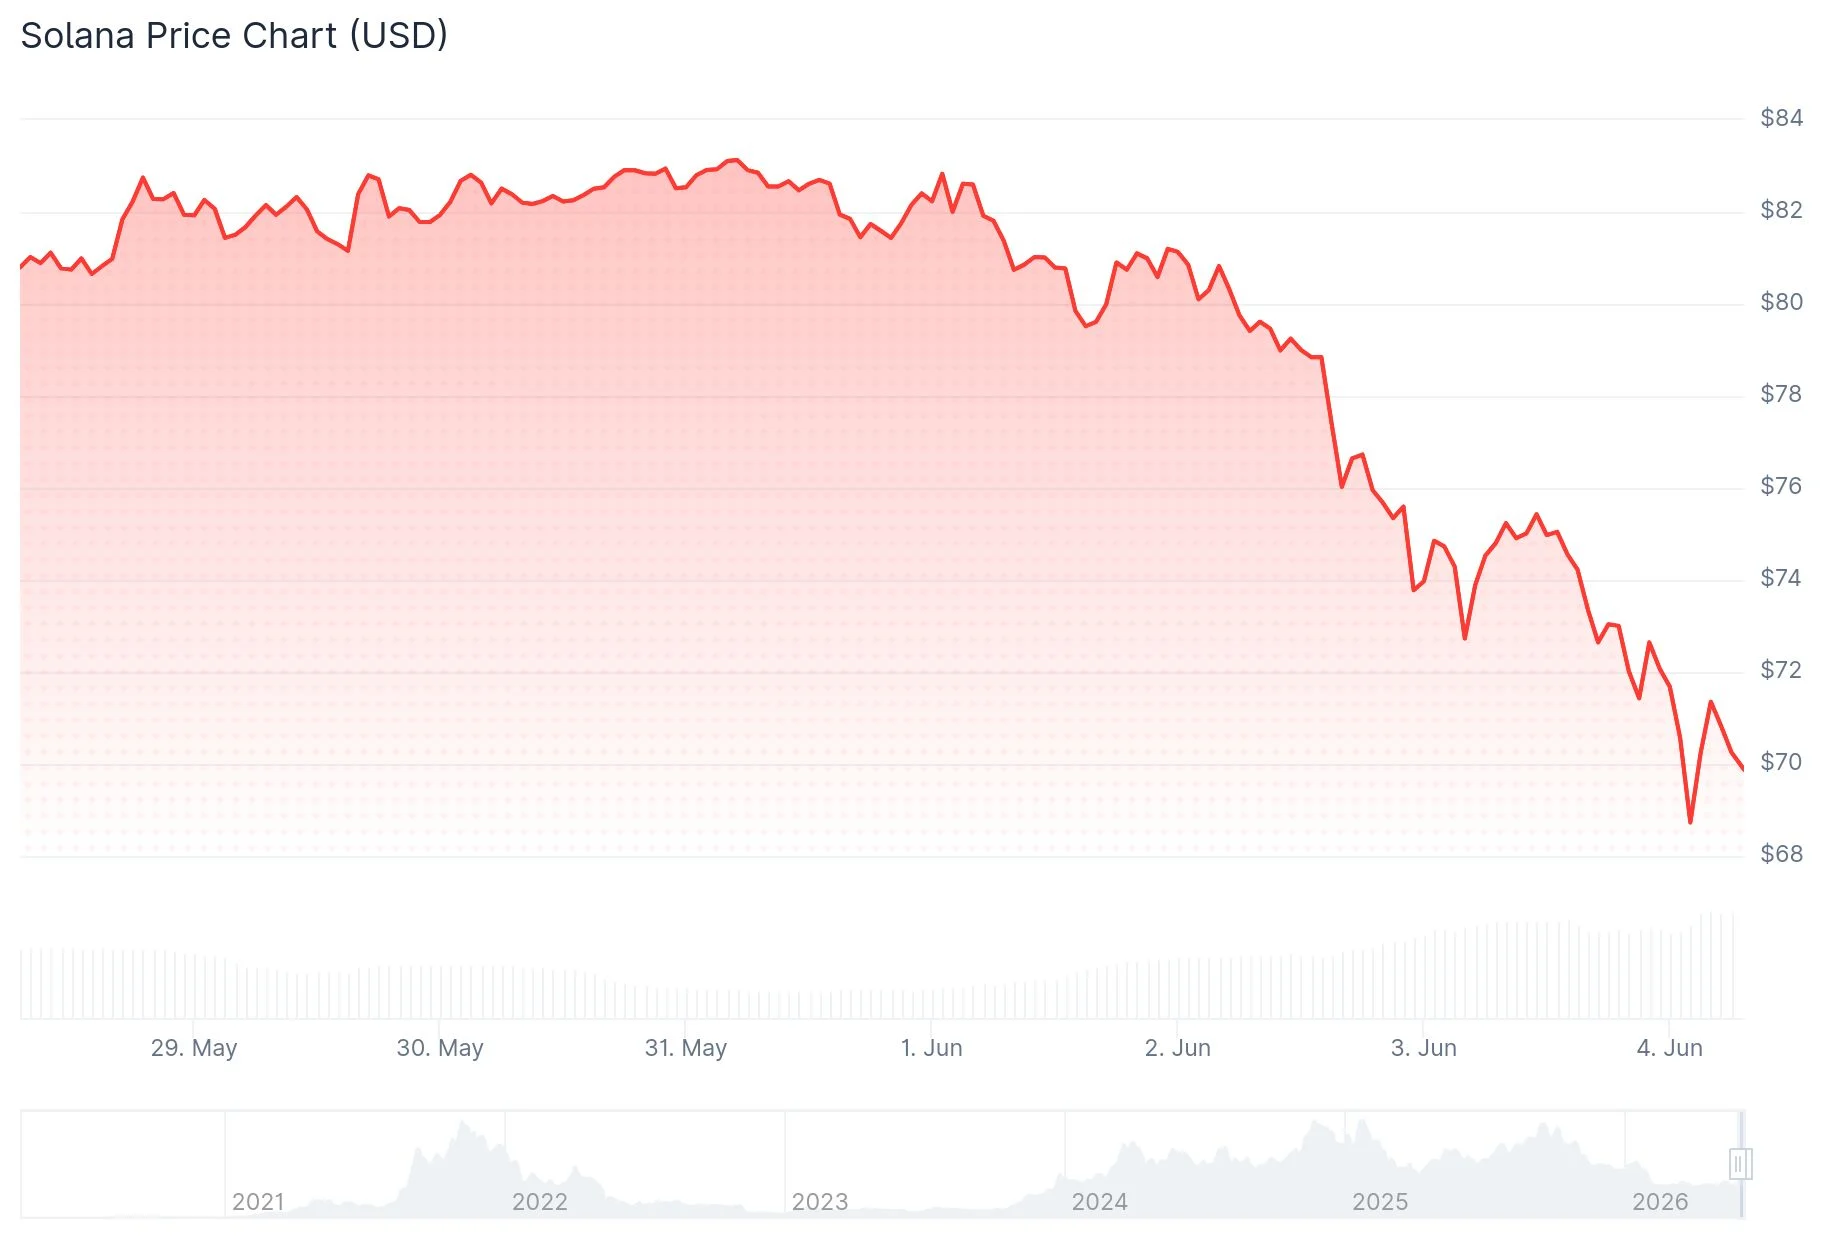
The digital asset has declined 6.45% over the previous day and has experienced a steep 42% drawdown since the beginning of 2026, positioning it among the poorest performers within the large-cap cryptocurrency segment.
Cryptocurrency analyst Ali Martinez highlighted the $77 price point as a crucial demand zone, utilizing insights from the UTXO Realized Price Distribution (URPD) framework. This technical model revealed substantial historical investor accumulation at that level, suggesting significant buying activity occurred within that range.
Following the breakdown of this zone, Martinez observed a noticeable absence of buying support beneath $77. His analysis pinpoints $53, $35, and $24 as subsequent zones where buyer interest might emerge.
When significant support levels collapse, market volatility typically accelerates as the number of willing buyers diminishes, creating an environment where selling pressure faces less resistance.

Bearish Signals Dominate Technical Framework
SOL’s price action now unfolds entirely beneath all prominent moving averages. TradingView analytics reveal the 20-day EMA positioned at $81.19, while the 50-day stands at $84.44, the 100-day at $89.84, and the 200-day at $105.62.
This configuration spanning multiple timeframes validates that the prevailing trend remains decisively negative. The MACD momentum indicator reinforces this outlook, with the MACD line positioned beneath the signal line while expanding negative histogram bars demonstrate accelerating downward pressure.
Analyst Daan Crypto Trades weighed in on the wider altcoin landscape, observing that numerous tokens display chart patterns resembling SOL’s current structure. He referenced consolidation periods extending beyond four months that have experienced breakdowns or significant wicks beneath range boundaries. Daan suggested favorable trading opportunities would emerge once price action recaptures those local ranges, potentially enabling moves toward range highs or beyond.
The Relative Strength Index (RSI) on the weekly timeframe registers at 32, a reading generally interpreted as bearish when declining beneath the 40 threshold.
Network Metrics Show Concerning Decline
Decentralized exchange activity on Solana has experienced a dramatic 62% contraction since the beginning of the year. During peak performance, the network processed $111 billion in monthly DEX volume. Recent data shows this metric has retreated to just $42 billion.
Overall transaction throughput across the network has similarly stagnated near 700 million weekly transactions following a peak of 959 million recorded in early February.
Market observers attribute the slowdown primarily to diminishing enthusiasm for meme token speculation. Solana‘s blockchain ecosystem generated substantial recent activity through meme coin trading, and as investor interest in that sector waned, network utilization metrics followed suit.
The daily chart reveals SOL has penetrated below its 5-month consolidation boundary spanning $77 to $97. Technical analysts typically interpret such breakdowns as indications that the preceding downtrend will likely continue.
Immediate attention now shifts to the $65 level. Successfully defending this threshold could provide temporary stabilization, though failure to hold may accelerate movement toward Martinez’s identified $53 target zone.
Get 3 Free Stock Ebooks
Discover top-performing stocks in AI, Crypto, and Technology with expert analysis.
- Top 10 AI Stocks - Leading AI companies
- Top 10 Crypto Stocks - Blockchain leaders
- Top 10 Tech Stocks - Tech giants


