



Key Takeaways
- XRP currently trades between $1.00 and $1.01, positioned beneath all significant moving averages
- Spot ETF activity shows minimal momentum with institutional interest remaining subdued
- Open Interest in perpetual futures contracts has expanded to 2.74 billion XRP
- The Relative Strength Index hovers near 34, approaching oversold levels without confirmation of trend reversal
- Failure to maintain $1.00 could trigger a descent toward $0.976 and potentially $0.93
The digital asset XRP remains precariously positioned above the psychologically significant $1.00 threshold, which now serves as a critical battleground for bulls and bears. Selling pressure has dominated market action for multiple weeks, with technical indicators consistently pointing toward continued weakness.
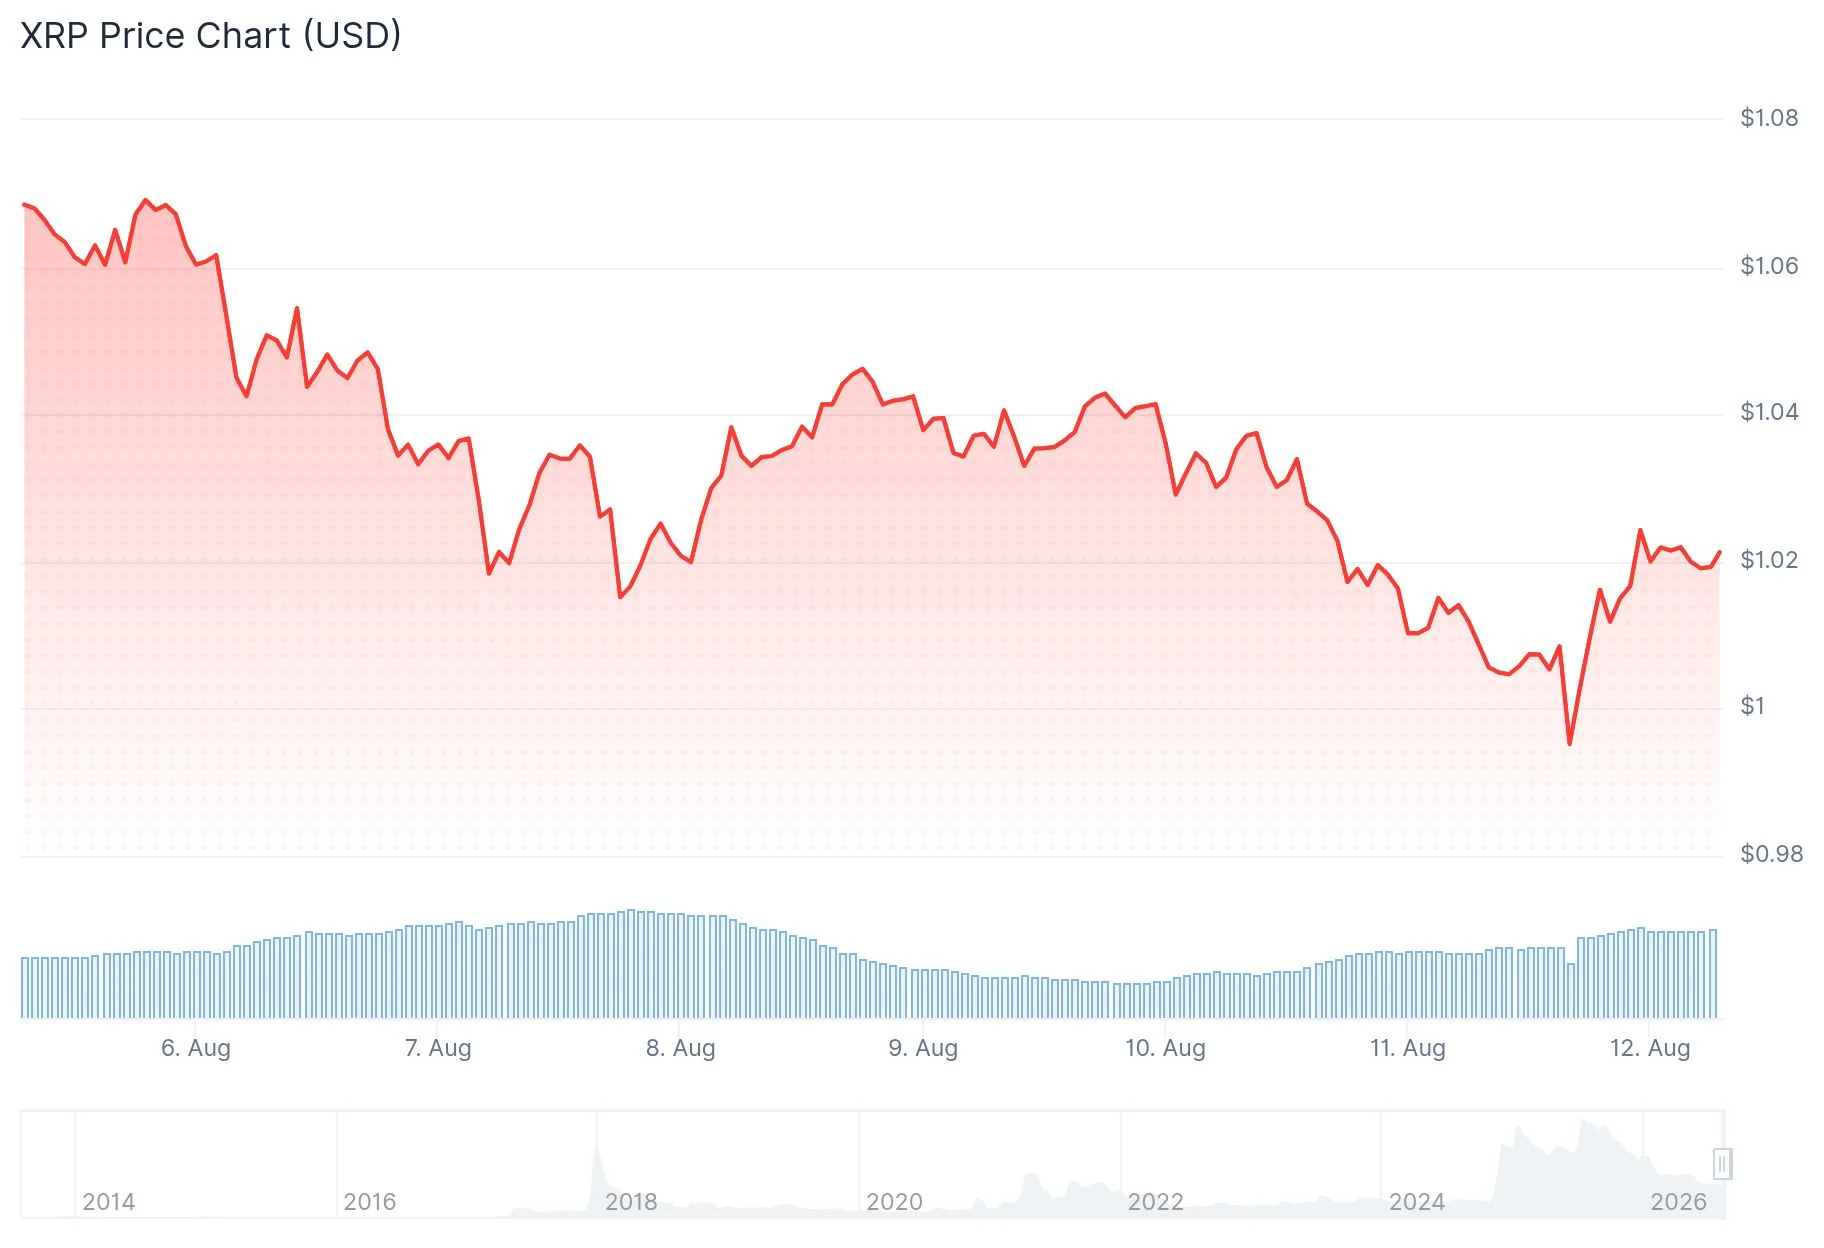
Currently, XRP trades beneath every major moving average including the 10-, 20-, 30-, 50-, 100-, and 200-day timeframes. This uniform bearish structure across multiple durations represents a substantial indication that market control remains with sellers.
Resistance zones are clearly defined: the 50-day exponential moving average stands near $1.10, while the 100-day EMA tracks around $1.18, and the 200-day EMA positions itself at approximately $1.37. Any bullish attempt would need to overcome these formidable barriers.
Market analyst Ali Charts observed through a post on X that XRP has declined 71.7% from its peak of $3.66 reached in July 2025, emphasizing that the asset is trading at “extremely oversold levels” with “new buy signals beginning to emerge.” This commentary has drawn attention from traders searching for potential bottoming patterns.
Institutional Interest and Market Psychology Remain Subdued
Exchange-traded funds focused on XRP in the United States continue to register minimal trading activity. Total cumulative inflows hold steady at $1.51 billion, while assets under management stand at $950 million. However, daily flow data reveals stagnant institutional participation.

Market sentiment, as measured by the Crypto Fear & Greed Index, registers a reading of 29, firmly placing market psychology in “Fear” territory. This pessimistic outlook persists amid geopolitical tensions and an absence of meaningful catalysts to stimulate buying pressure.
Meanwhile, the derivatives market shows increased activity with perpetual futures Open Interest rising to 2.74 billion XRP from the previous day’s 2.62 billion. This represents a 23% jump compared to early August figures, potentially indicating heightened speculative positioning.
Critical Price Zones Under Scrutiny
Chart analyst @ashleytheduke pointed out XRP’s formation of declining highs and lows on daily timeframes. The breach below $1.06 eliminated an important near-term support structure and has further degraded the immediate technical outlook.
Trader Apex_Legends mapped out a descending channel formation with initial downside targets near $0.9760. Should the $1.00 level fail to provide adequate support, traditional pivot point analysis suggests sequential support zones at $0.993, followed by $0.926, and extending down to $0.764.
The RSI currently measures between 33 and 35, nearing oversold conditions but lacking a definitive bullish divergence or crossover. The Stochastic RSI Fast indicator reads approximately 9.77, while Williams %R sits around -96.54, both reflecting sustained downward momentum.
For bulls to gain traction, XRP must first recapture the $1.06 level before challenging resistance between $1.08 and $1.15. Current market pricing remains anchored around the $1.00 to $1.01 range.
Get 3 Free Stock Ebooks
Discover top-performing stocks in AI, Crypto, and Technology with expert analysis.
- Top 10 AI Stocks - Leading AI companies
- Top 10 Crypto Stocks - Blockchain leaders
- Top 10 Tech Stocks - Tech giants



