



Key Takeaways
- XRP recorded a weekly close of $1.029, marking its weakest weekly finish in approximately two years
- The digital asset has declined approximately 44% since the start of the year and currently trades near $1.03
- Technical analyst Bird identifies a potential double-bottom W-formation developing at the $1 support level
- Market analyst ChartNerd forecasts a decline to $0.7 before any substantial recovery materializes
- Large holders accumulated 380 million XRP tokens within a seven-day period amid ongoing market volatility
The cryptocurrency XRP has registered its weakest weekly closing price in approximately two years, settling at $1.029 as last week concluded. The digital asset currently trades around the $1.03 mark, representing a decline of approximately 0.5% over the last 24-hour period and a 3.43% decrease across the previous week.
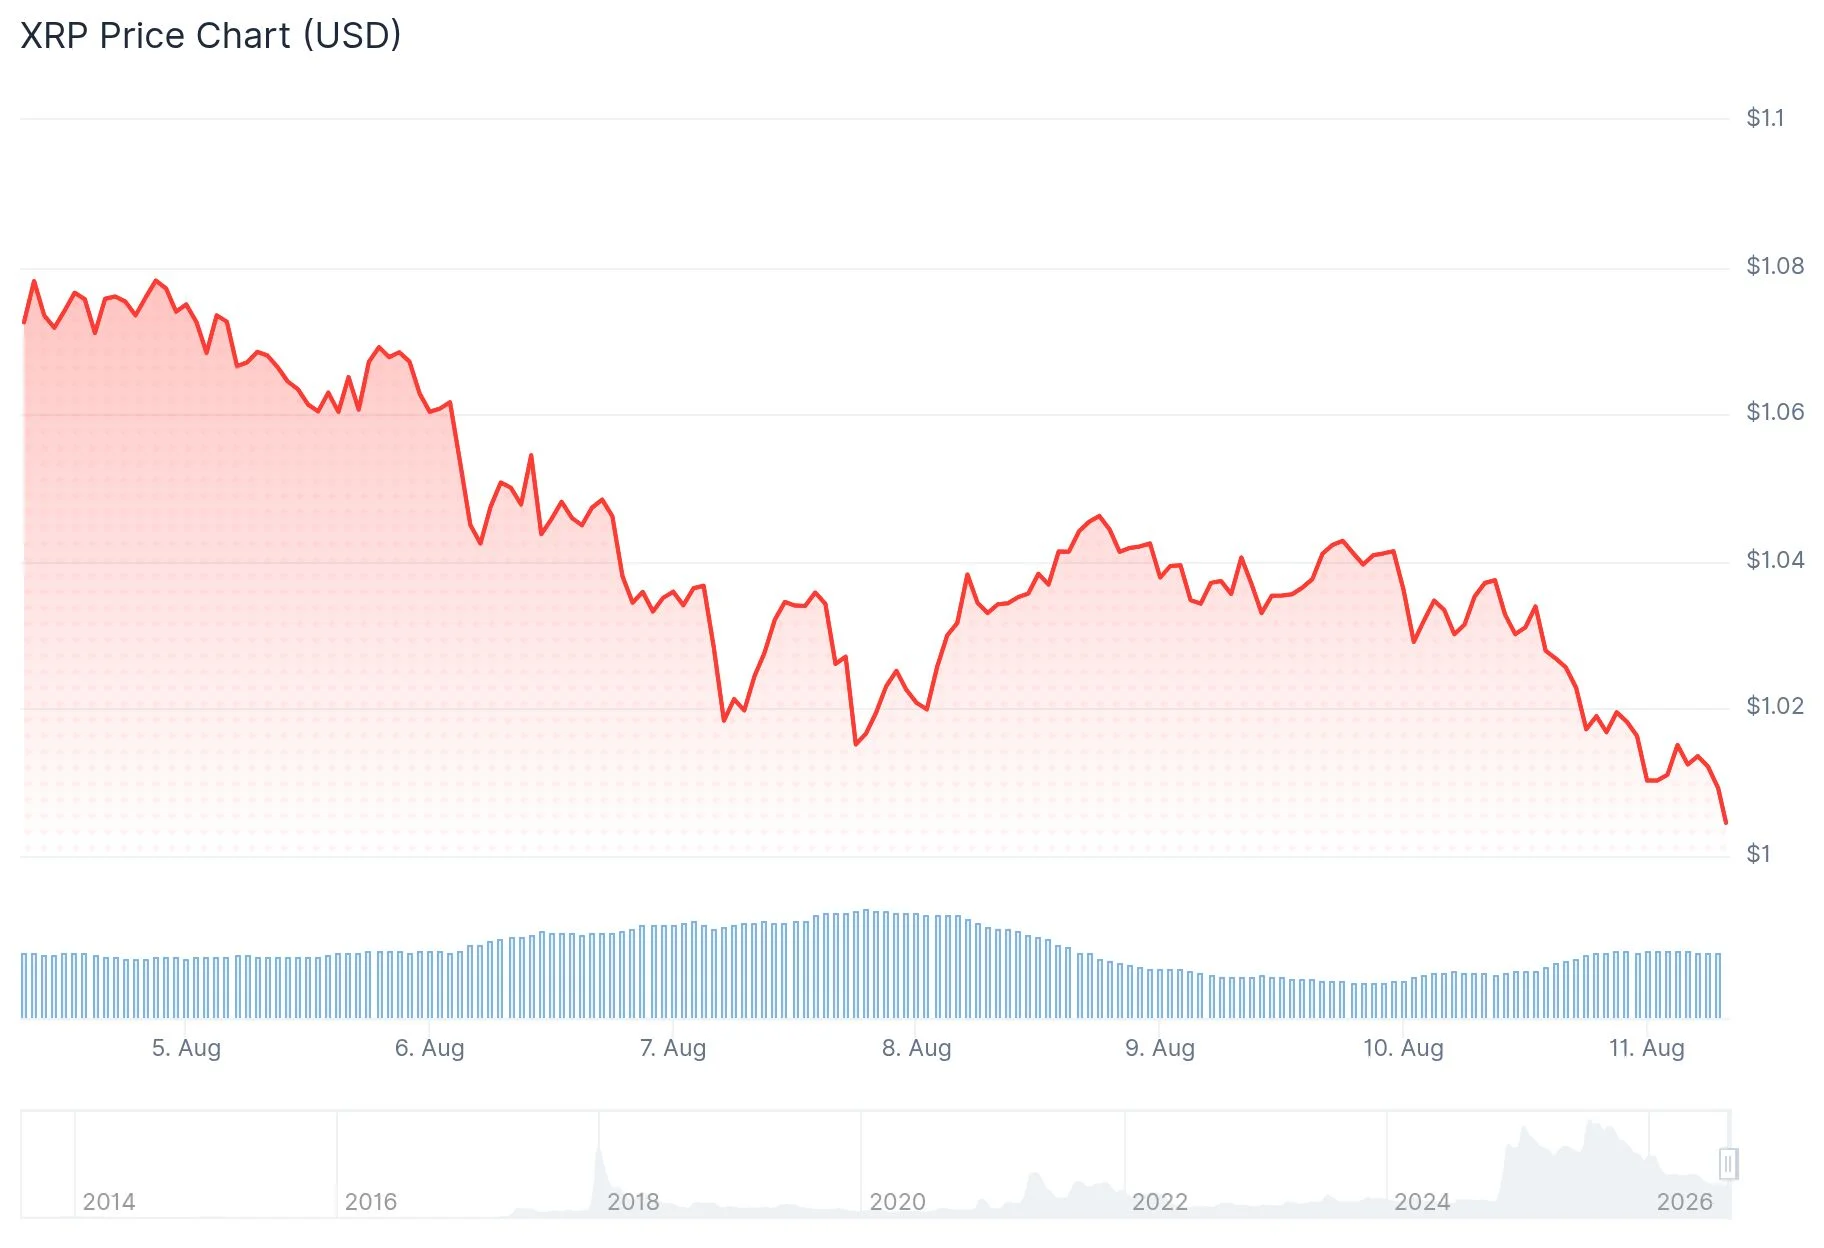
Since the beginning of the year, XRP has experienced a decline of approximately 44%, returning the token to a price range that has historically served as significant support territory.
Market analyst Ash Crypto was among the initial observers to highlight this development, emphasizing that this weekly close represents the most bearish XRP has exhibited in nearly 24 months.
Market commentator That Martini Guy provided his perspective on X, stating that XRP “just closed its lowest week in nearly 2 years at $1.029,” characterizing it as “a serious breakdown.” He emphasized that the critical question facing traders is whether this represents “the start of a deeper reset, or the kind of capitulation that eventually creates the next opportunity.” He confirmed he is “watching this one closely.”
Will XRP Form a Double Bottom or Decline to $0.70?
XRP developer and market analyst Bird observes that XRP is currently positioned directly on a significant support zone at the $1 level. He has identified two potential scenarios that could unfold from this critical juncture.

The first scenario involves XRP maintaining the $1 threshold, establishing a double-bottom pattern, and completing a W-shaped reversal structure that could propel prices upward.
The alternative scenario involves XRP temporarily breaking below $1 to capture liquidity before recovering above this level and initiating a more robust upward movement. Bird suggested that either trajectory could ultimately result in higher valuations.
Market analyst ChartNerd adopts a more conservative perspective. He anticipates XRP declining to the $0.70 range before any significant recovery emerges, and projects the token will continue trending downward through the conclusion of 2026.
Technical Buy Signal and Large Holder Accumulation
Market analyst Ali Martinez highlighted that the TD Sequential indicator has generated a buy signal on XRP’s monthly timeframe. Historical instances of this signal preceded substantial gains of 1,074% during 2020 and 973% in 2022.
Martinez further noted that XRP needs to surpass $1.06 initially, a resistance threshold where approximately 3 billion XRP tokens changed hands. A monthly close exceeding this level could establish a pathway toward $1.35 and subsequently $1.64.
The daily Relative Strength Index currently registers at 39, remaining within bearish parameters. A movement above the 50 level on the RSI could facilitate XRP’s breakthrough of the $1.06 resistance barrier and set sights on the 50-day Exponential Moving Average positioned at $1.10.
Analyst Ali Charts observed that XRP large holders acquired 380 million tokens during a single week, indicating that major investors maintain conviction despite ambiguity surrounding the CLARITY Act’s potential passage in 2026. Successfully closing above the 50-day EMA at $1.10 for three consecutive days could subsequently drive XRP toward the 200-day EMA located at $1.18.
Get 3 Free Stock Ebooks
Discover top-performing stocks in AI, Crypto, and Technology with expert analysis.
- Top 10 AI Stocks - Leading AI companies
- Top 10 Crypto Stocks - Blockchain leaders
- Top 10 Tech Stocks - Tech giants



