


Key Takeaways
- Solana is currently trading near $75.27, maintaining position above critical $74.50 support zone
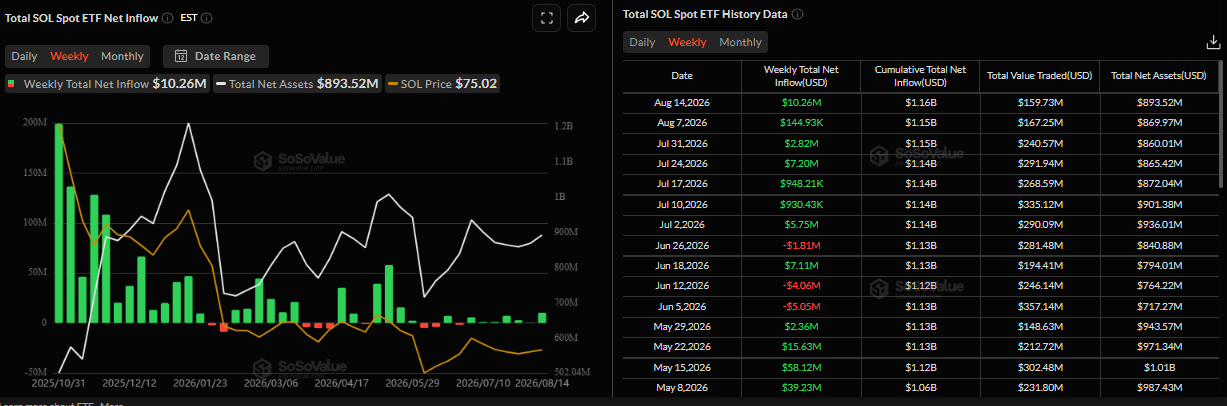
- Spot SOL exchange-traded funds in the United States recorded $10.26 million in net inflows during the past week — marking the seventh consecutive week of positive capital flows
- Technical analysis reveals a falling wedge formation on the 4-hour timeframe, projecting a potential breakout toward $77.10
- Momentum indicators show the RSI hovering around neutral 52 levels while MACD maintains positive territory, indicating balanced market sentiment
- Should prices close below $73.64 on the daily chart, SOL could face additional downside pressure
Solana maintains stability above the $75 threshold as a combination of technical chart formations and sustained institutional capital inflows suggest measured bullish sentiment. At press time, SOL was changing hands at $75.27, registering a 24-hour trading volume near $2.27 billion alongside a market capitalization hovering around $43.86 billion. The digital asset experienced a modest decline of approximately 0.1% over the previous day.
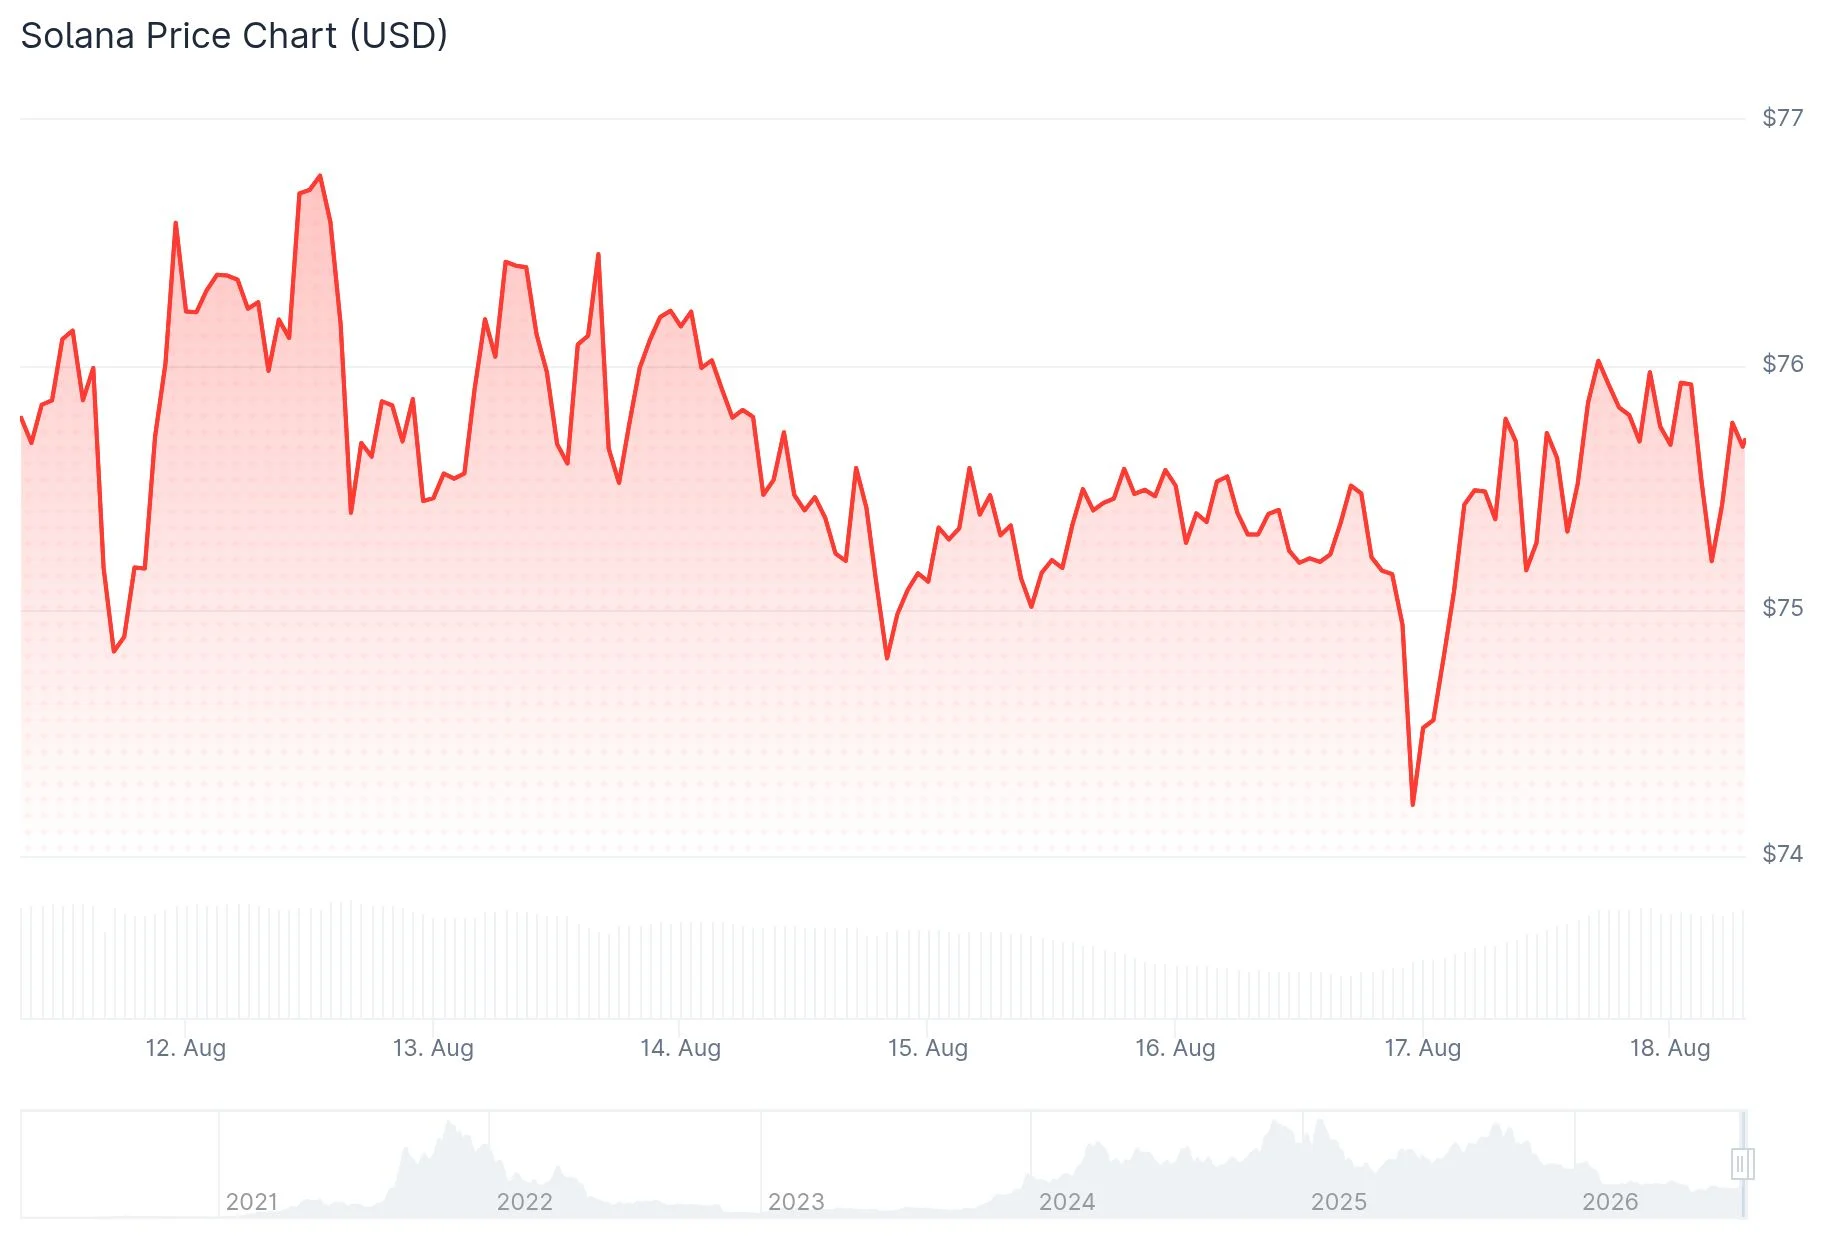
Following a 2.18% retreat during the previous week, the price has discovered support along an upward-sloping trendline. Currently, SOL is positioned marginally above its 50-day Exponential Moving Average (EMA), which stands at $75.48.
Market analyst Bluntz shared insights via X, highlighting “strong pa on $SOL” while acknowledging the asset has appeared “somewhat boring” due to what appears to be an ongoing accumulation period. The analyst identified a weekly bullish divergence pattern that could potentially signal a bottom formation.
Institutional Capital Continues Flowing Into SOL ETFs
Investment from institutional sources has demonstrated consistent strength. Data from SoSoValue indicates that US-based spot Solana exchange-traded funds attracted $10.26 million in net inflows throughout the previous week. This figure represents the strongest weekly performance since May 22 and extends the streak of positive inflows to seven straight weeks.
Information from CryptoQuant suggests a modest bullish tilt, with significant whale accumulation evident in spot trading venues while futures market activity shows signs of cooling. Additional blockchain metrics present a neutral picture.

Looking at longer-term moving averages, the 100-day EMA is positioned at $78.10, while the 200-day EMA resides higher at $88.69. These levels continue to function as overhead resistance barriers, maintaining the broader price action within a range-bound framework.
Technical Pattern Emerges on Lower Timeframe Chart
On August 17, the analytical team at Alpha Crypto Signal identified a falling wedge pattern developing on Solana’s 4-hour chart. This technical configuration displays price action confined between two converging downward-sloping trendlines with diminishing volatility — a structure frequently associated with upward breakout movements.
SOL is currently trading in proximity to the middle Bollinger Band positioned at $74.50. The upper boundary of this indicator rests at $77.10, while the lower band is located at $71.91.
The MACD histogram currently reads 0.10329, with the MACD line positioned at 0.05374 and the signal line at -0.04955, reflecting strengthening momentum characteristics.
A decisive move above the upper boundary of the wedge formation, accompanied by rising trading volume, would establish $77.10 as the initial upside objective. Conversely, failure to defend the $74.50 level would compromise the bullish technical setup and bring $71.91 into consideration as the next support zone.
Solana has not yet validated a breakout movement. The trading sessions ahead will prove crucial in establishing the asset’s directional trajectory.
Get 3 Free Stock Ebooks
Discover top-performing stocks in AI, Crypto, and Technology with expert analysis.
- Top 10 AI Stocks - Leading AI companies
- Top 10 Crypto Stocks - Blockchain leaders
- Top 10 Tech Stocks - Tech giants



