


Key Highlights
- Solana jumped 8.70% over the last 24 hours, currently trading around $97.09 with a total market capitalization approaching $56.56 billion
- The asset crossed the $90 threshold for the first time in three months, pushing through two critical resistance zones
- Short sellers faced liquidations exceeding $4.6 billion across a three-day period
- After 202 days of consolidation, SOL now tests the $95–$100 breakout zone
- A confirmed break above $100 could open the path toward $120, according to market analysts
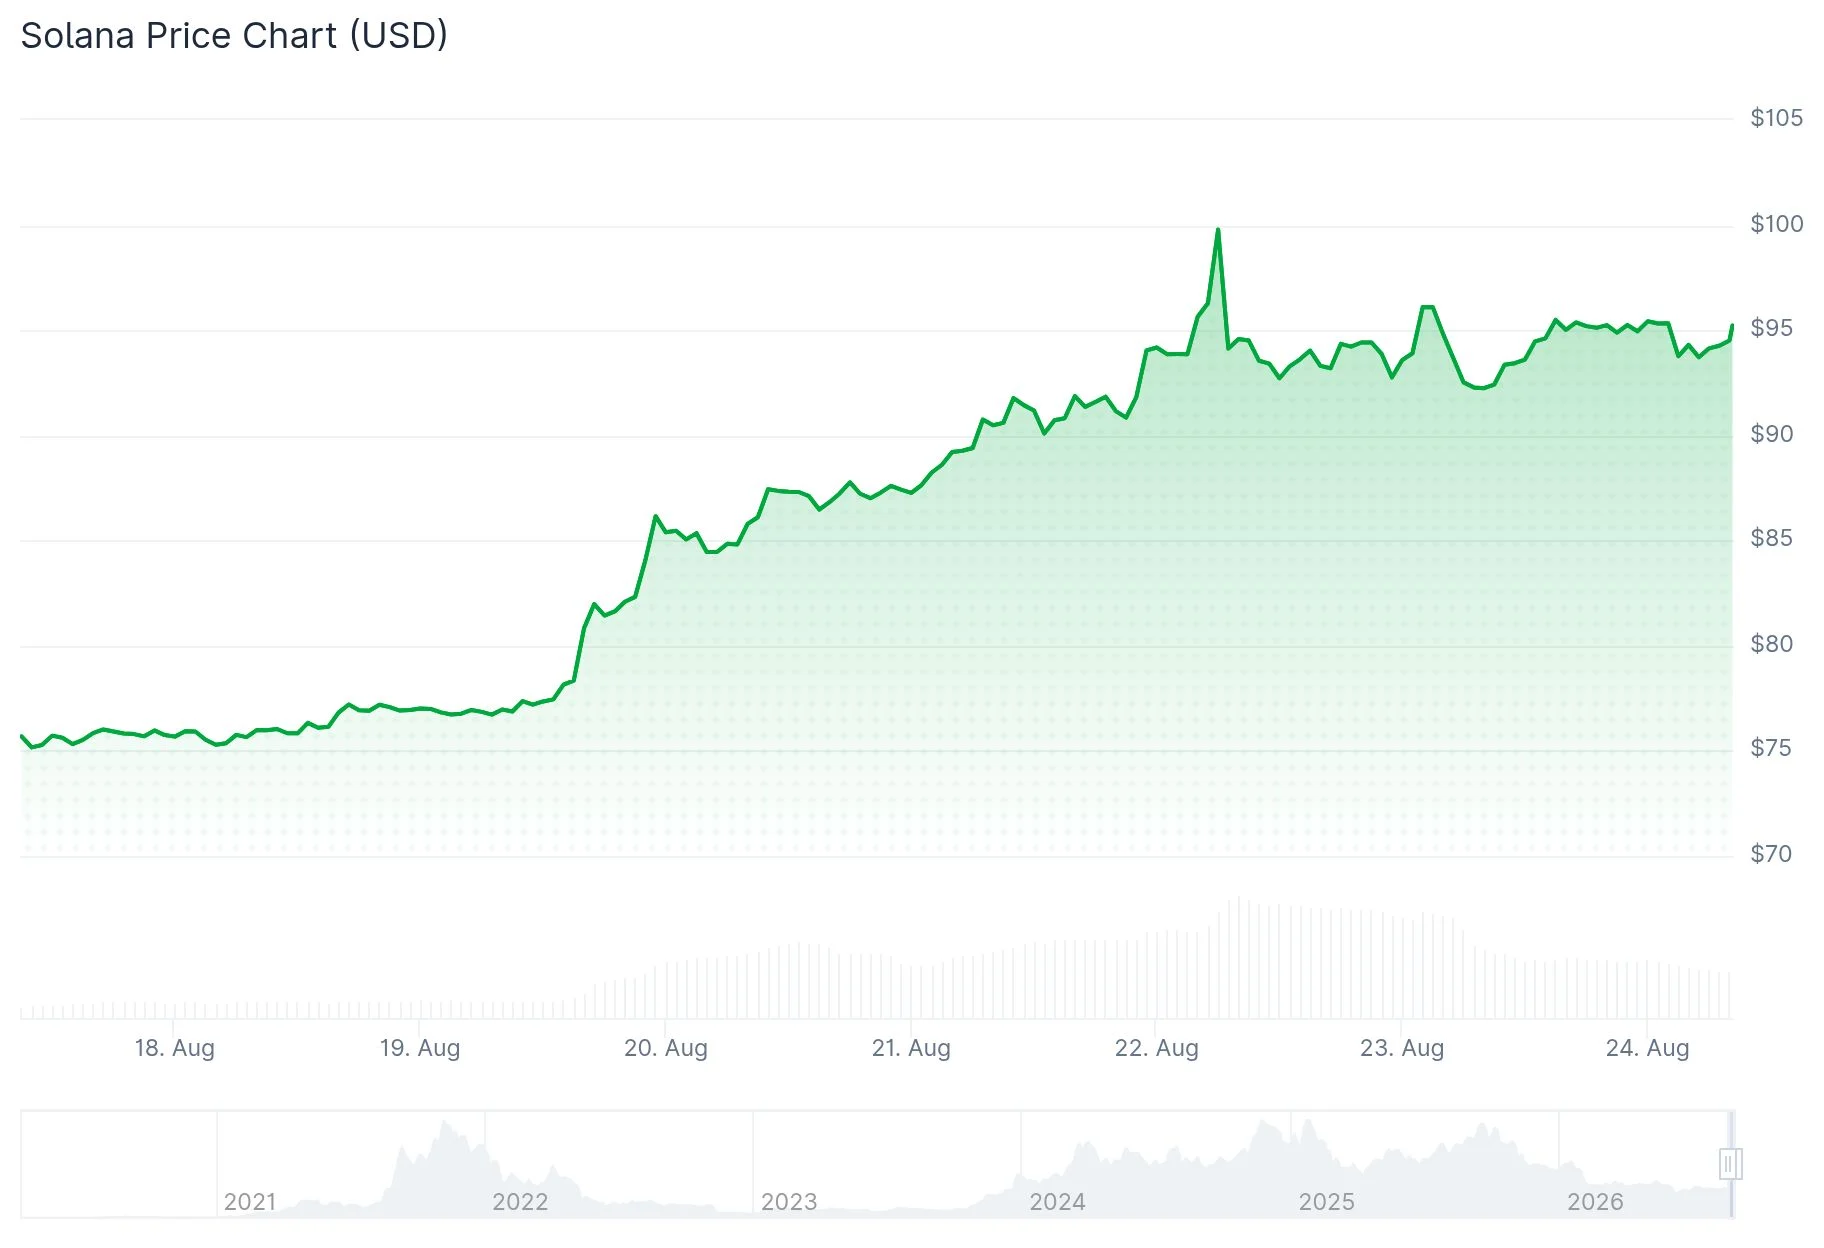
Solana has delivered one of its most impressive rallies in recent months, surging from the low $80s to approach $97 within days. The digital asset posted an 8.70% gain over the past day and has rallied approximately 25% throughout the week.
Daily trading volume jumped by nearly 50%, reaching $9.5 billion—representing roughly 17% of SOL’s total circulating supply. This dramatic increase in activity fueled a significant short squeeze throughout the cryptocurrency markets.
More than $4.6 billion in bearish bets were wiped out over just three days as Solana continued its upward trajectory. On August 18 alone, liquidations reached $2.9 billion, marking the 8th largest single-day liquidation event in cryptocurrency trading history.
The upward movement followed the U.S. Securities and Exchange Commission’s announcement of a proposed regulatory framework for digital assets. This development triggered a notable shift in market sentiment across the crypto sector.
The Crypto Fear and Greed Index climbed from approximately 36 (neutral territory) to around 76, indicating that market participants have entered a phase of greed.

Solana also pushed above its 200-day exponential moving average while clearing two previous resistance zones at $78 and $90. The breach above $90 marked the first time SOL reached that price point in over three months.
Breaking Out After 202 Days of Consolidation
According to market analyst Ran Neuner, Solana consolidated for approximately 202 days within its accumulation zone before initiating this rally. The top of that range sits precisely around $97–$100, an area that price is currently challenging.
A daily candle close beyond $100, followed by a successful backtest of that level, would validate that the consolidation range has broken to the upside. Analyst Altcoin Sherpa has pinpointed $120 as the subsequent major obstacle if this scenario plays out.
Cryptocurrency trader KillaXBT disclosed publicly that his SOL position has gained 50% from his entry. He views $100–$105 as the immediate resistance zone, but anticipates a rally into the $120 range once that barrier is overcome.
On-Chain Metrics Support the Rally
Solana ETF net inflows have reached $38 million, marking the strongest positive reading since May. Additionally, a bullish crossover between the 30-day and 50-day moving averages for daily active users occurred just before this price movement.

When this identical crossover pattern emerged in June 2025, Solana rallied from $145 to $245 during the subsequent months.
Critical Price Levels to Monitor
Near-term support is positioned at $90–$92. A more substantial correction could bring price back to $83, where the 200-day EMA currently provides support. The RSI indicator has moved into overbought conditions, suggesting the possibility of a short-term retracement before any further advance.
Solana’s critical levels include: support at $80–$82, resistance at $95–$100, and upside objectives at $110–$120, followed by $140, with a longer-term target of $200.
Solana ETF net inflows presently total $38 million, representing the highest level recorded since May.
Get 3 Free Stock Ebooks
Discover top-performing stocks in AI, Crypto, and Technology with expert analysis.
- Top 10 AI Stocks - Leading AI companies
- Top 10 Crypto Stocks - Blockchain leaders
- Top 10 Tech Stocks - Tech giants



