


Key Highlights
- SOL gained approximately 1.90% to reach $76.29, escaping a falling wedge formation
- Critical resistance levels identified at $77–$79, with $80 representing the next psychological barrier
- Technical analysts project potential upside to $82, $98, $114, and $130
- Solana ETFs in the US saw no net inflows on August 7, maintaining total assets at $869.97 million
- The cryptocurrency has established a pattern of ascending highs and lows since its June floor
Solana has successfully escaped from a falling wedge formation that had been developing throughout early July. Currently, SOL is changing hands around $76.29, reflecting a gain of roughly 1.90% in the last 24-hour period.
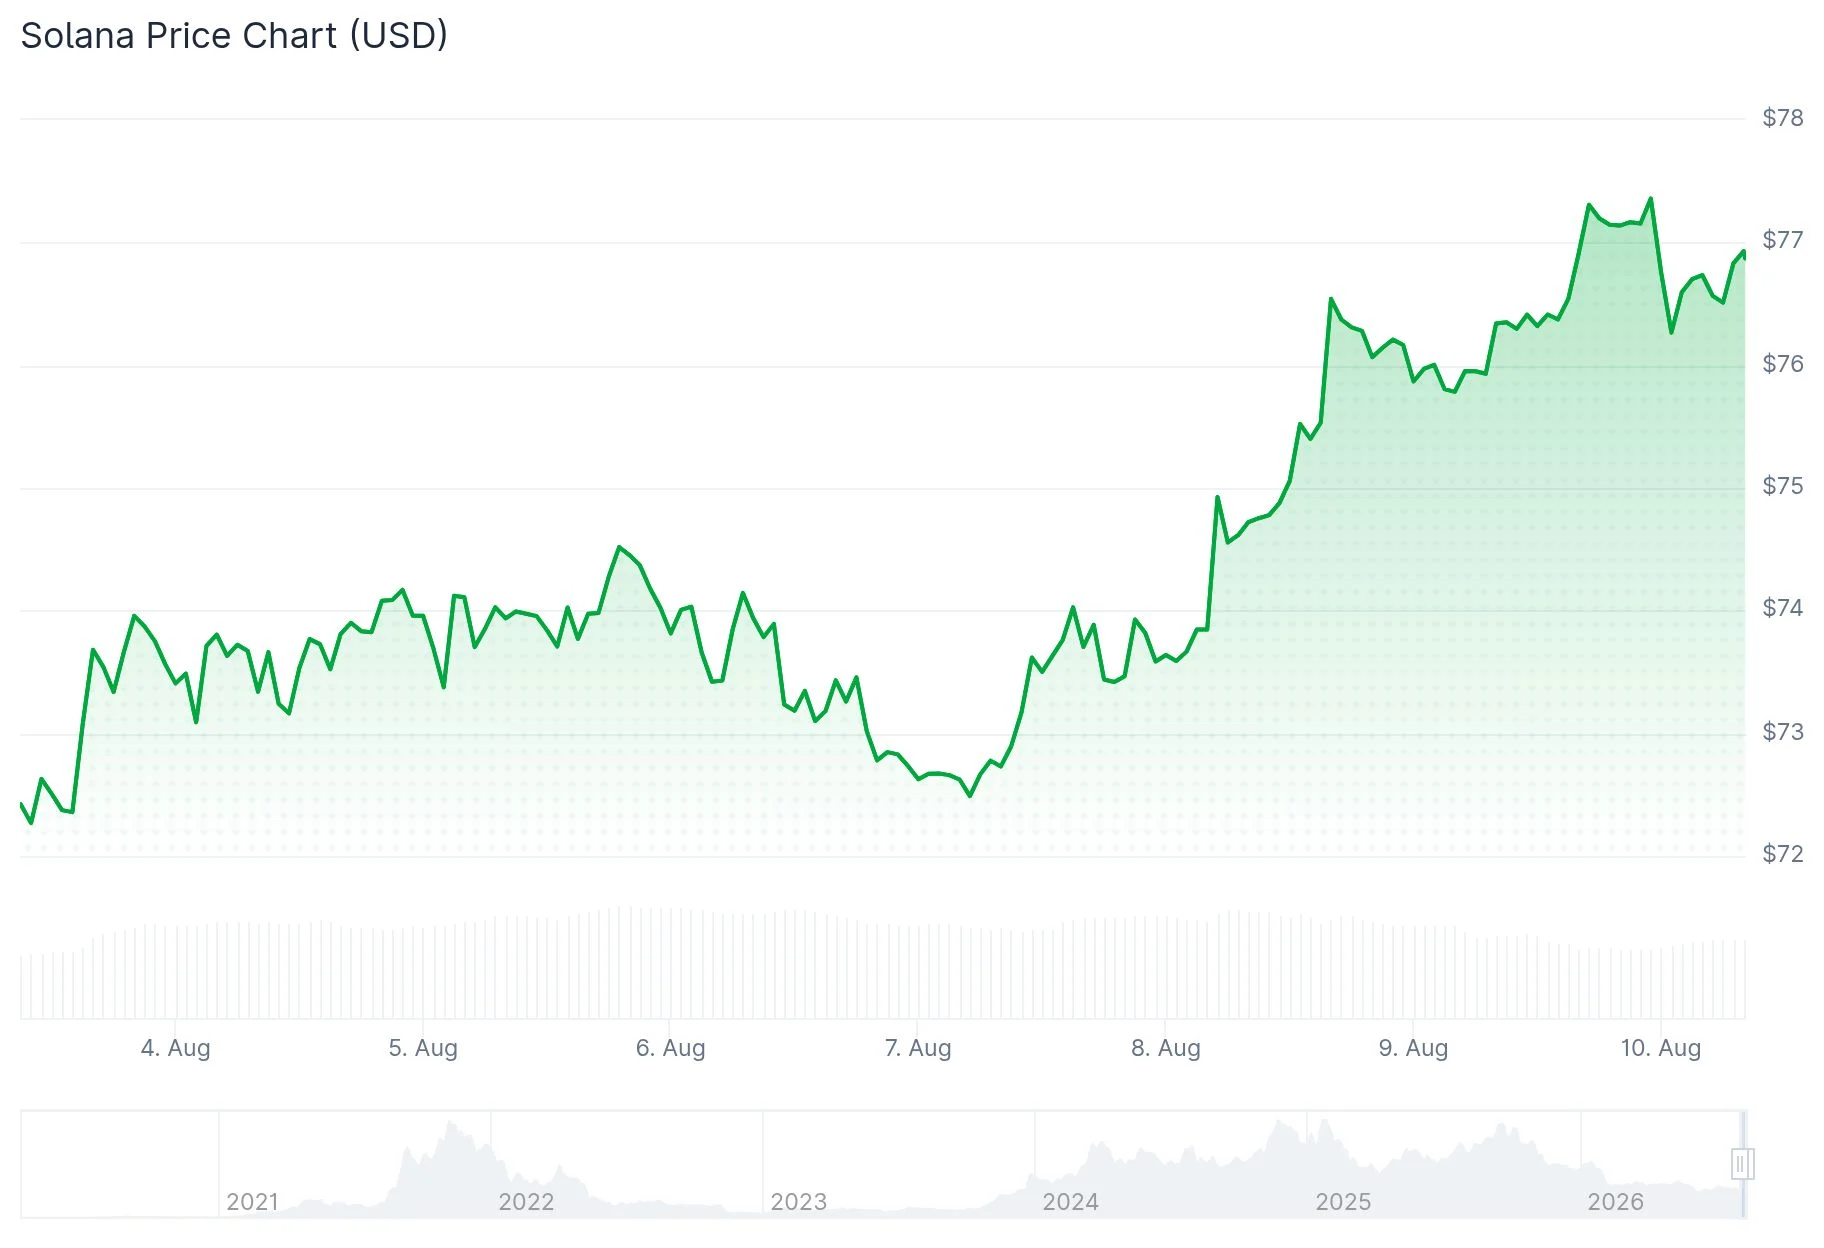
The technical breakout occurred when SOL climbed above its downward-sloping resistance boundary around the $74–$75 level. The asset has since advanced to $76, representing its first decisive exit from the pattern in multiple weeks.
Market analyst CryptoJack drew attention to this breakout via social platforms, emphasizing how price action decisively penetrated the resistance barrier. However, the movement requires additional confirmation through sustained buying pressure.
The immediate resistance zone spans $77–$79. A convincing breach of this range would redirect attention to the early-July peaks between $82–$84.
Technical analyst Daan Crypto Trades observed that SOL has been establishing progressively higher peaks and troughs since reaching its June floor. According to his assessment, SOL requires only modest additional upward movement to initiate its next bullish phase, though this depends on broader market stability.

ETF Activity Shows No Movement
According to data from SoSoValue, US-based spot Solana ETFs registered zero net inflows during the August 7 trading session. Combined assets under management totaled $869.97 million, accounting for 2.02% of Solana’s overall market capitalization.
Bitwise’s BSOL maintained its position as the largest fund with $594.45 million in holdings. Fidelity’s FSOL managed $125.41 million while Grayscale’s GSOL controlled $96.81 million. Despite the absence of new capital flows, most products experienced market price appreciation exceeding 1.6%.
Technical Price Projections
Technical analyst TraderDaink identified multiple upside objectives should the current consolidation phase transition into a confirmed breakout. The initial significant target stands at $82.25, with subsequent levels at $98.40, $114.55, and $130.70.
Analyst Gareth Soloway characterized the price action as a textbook wedge breakout pattern with potential to reach $100. He emphasized that the breakout gains credibility if SOL maintains support above the $74–$75 range.
Reaching the $100 milestone would necessitate breaking through the $82–$84 zone first, followed by the $97–$98 resistance area.
Critical Price Zones
The Relative Strength Index currently reads 71.14, positioning SOL slightly within overbought territory. The MACD indicator shows the main line above its signal counterpart, supporting a bullish interpretation.
Solana must defend the $76 level to preserve its near-term bullish structure. A decline beneath $75 would bring $74 into play, with more substantial support positioned around $72.
The existing breakout formation remains valid provided SOL continues trading above the lower-$70s range.
Get 3 Free Stock Ebooks
Discover top-performing stocks in AI, Crypto, and Technology with expert analysis.
- Top 10 AI Stocks - Leading AI companies
- Top 10 Crypto Stocks - Blockchain leaders
- Top 10 Tech Stocks - Tech giants



