


Key Highlights
- US-listed Solana spot ETFs have maintained 11 consecutive trading days of positive net inflows, recording $10.9M on September 1
- Cumulative ETF net inflows have surged to $1.35 billion, with total assets under management at $1.39 billion
- Derivatives trading volume for SOL increased 22% to reach $9.43 billion, though open interest declined marginally
- The token maintains crucial support above $95, with technical breakout levels identified at $110 and $120
- Market analyst Wealthmanager projects a long-term price objective of $250 if current support zones remain intact
The Solana (SOL) token is currently changing hands near $99 following a modest correction of approximately 3% over the last 24-hour period. However, the broader picture remains positive, with SOL posting gains of roughly 35% across the previous two-week span.
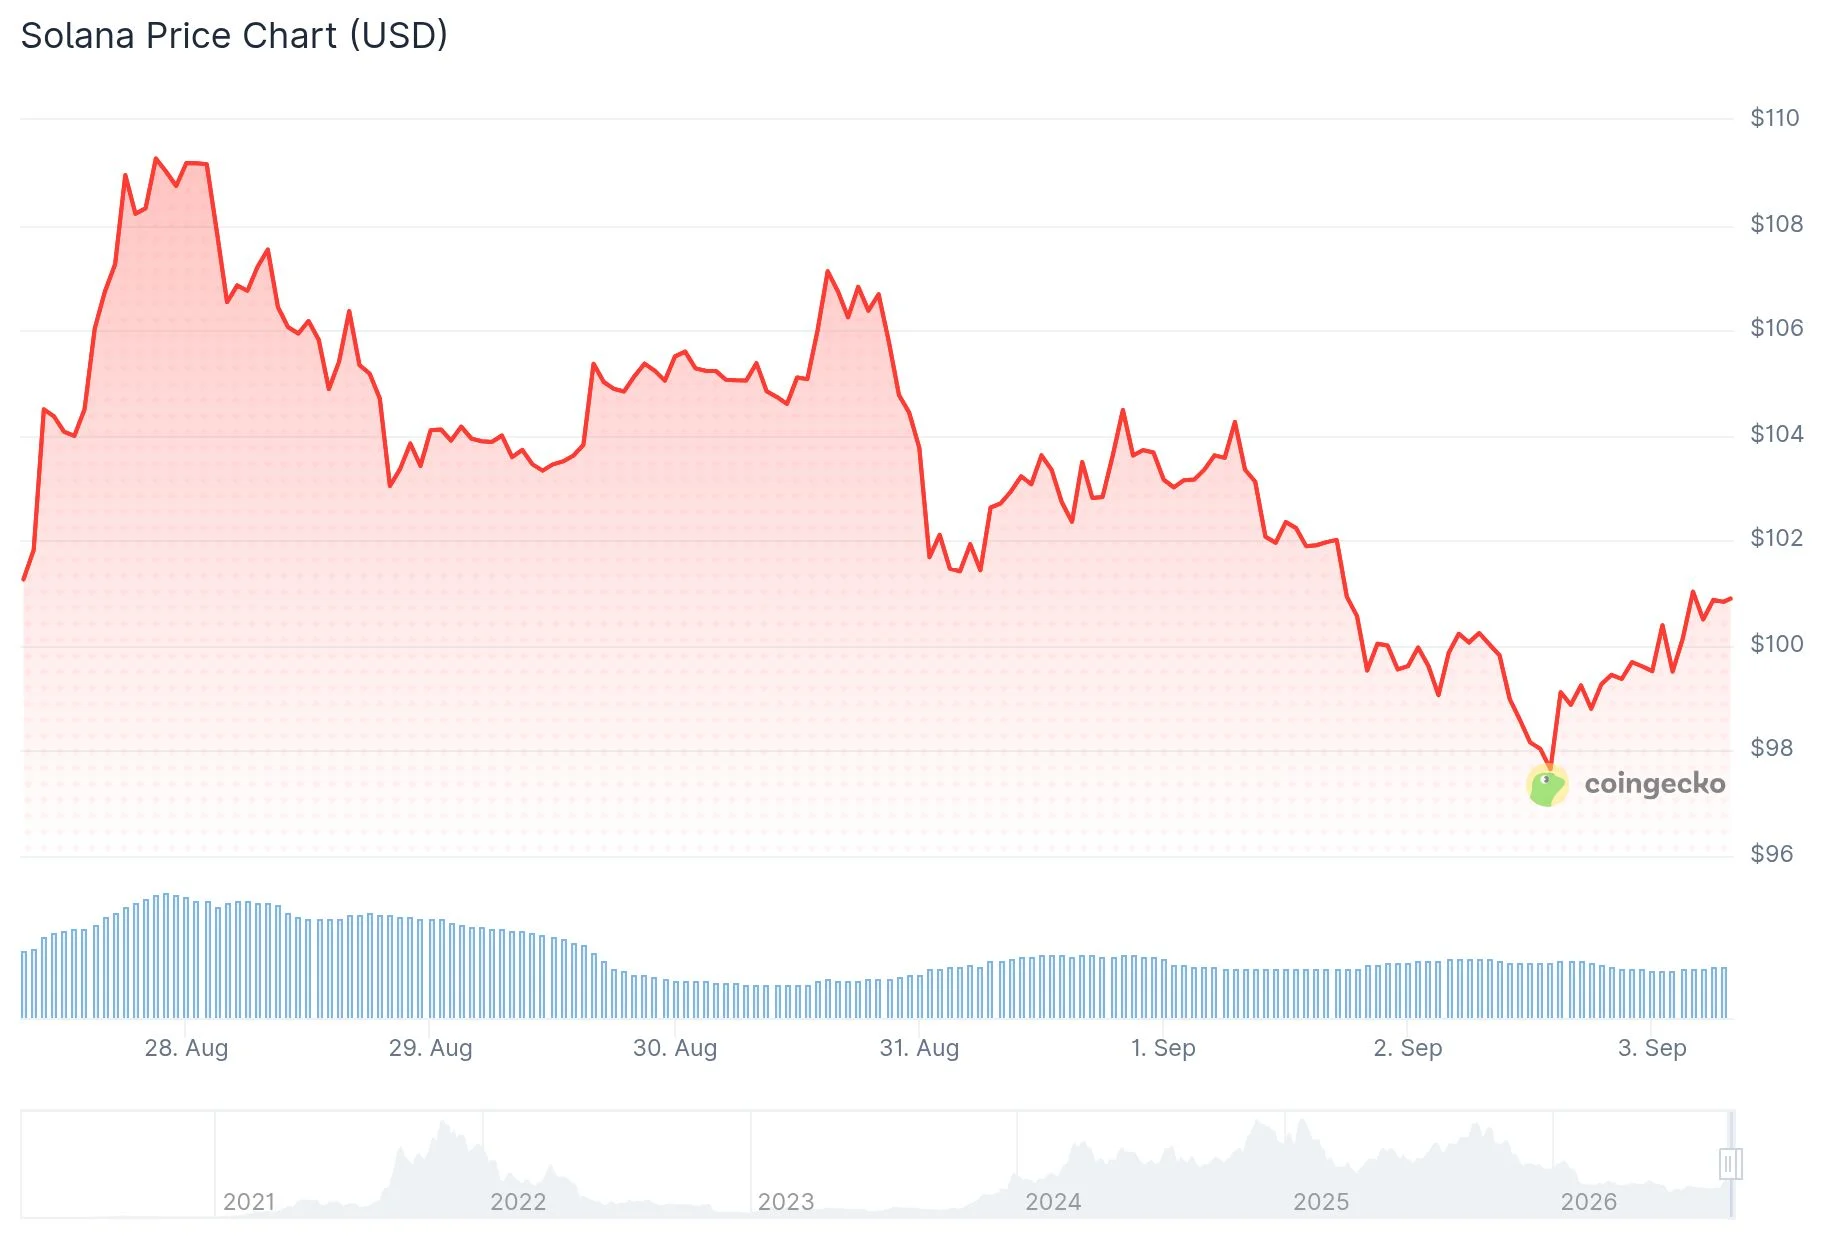
The digital asset dipped to $99.35 but managed to maintain stability above the psychologically significant $100 threshold during the majority of trading hours. The price action has been confined within a range of $97.38 to $100.71.
Solana ETFs in the US Maintain 11-Session Inflow Momentum
United States-based Solana spot exchange-traded funds have now achieved positive net capital flows for an unbroken stretch of 11 trading sessions. On September 1, these products registered daily net inflows totaling $10.19 million, while the preceding trading day captured $10.9 million in fresh capital.
Aggregate net inflows spanning all available investment vehicles have climbed to $1.35 billion. The combined assets under management currently stand at $1.39 billion, with trading volume for the day reaching $68.55 million.
Bitwise dominated daily capital attraction, securing $6.17 million in new inflows, with Fidelity following at $2.67 million. Morgan Stanley contributed $1.36 million to the total, while remaining listed products experienced zero net flows during this period.
Bitwise commands the largest overall position, managing $949.83 million in assets with cumulative lifetime inflows of $1.03 billion. This sustained inflow pattern demonstrates consistent institutional appetite even amid temporary price corrections.
Market analyst Ali Charts shared commentary on X, urging the community to abandon bearish sentiment on Solana. He indicated that the technical structure is shifting toward bullish territory and suggested this could be an opportune moment to establish positions ahead of SOL’s next significant price movement.

Derivatives Markets Signal Heightened SOL Trading Activity
Trading volume in Solana derivatives contracts expanded by 22% to reach $9.43 billion, reflecting growing trader engagement. Simultaneously, open interest contracted by 1.40% to $6.47 billion, indicating that certain leveraged traders opted to reduce their positions.
Options trading volume surged 19.30% to $15.18 million. Open interest in options contracts rose modestly by 2% to settle at $135.98 million.
The Relative Strength Index currently registers at 62.15, having retreated from previously overbought conditions. The Chaikin Money Flow indicator stands at 0.25, signaling continued capital accumulation in SOL.
Solana continues to defend the critical $95 support threshold, which market observers identify as essential for preserving the ongoing recovery pattern. A confirmed daily close above $100 would create a pathway toward the next resistance zone at $110.
Successfully breaching $110 with substantial trading volume could establish conditions for an advance toward $120. Market analyst Wealthmanager identified $250 as a viable long-term price objective if SOL can effectively retest its previous resistance area as new support following a breakout from the macro downtrend.
On the bearish scenario, a breakdown below $95 would expose SOL to the $90 price level. Extended weakness beneath $90 would redirect market attention toward the $80 zone.
The latest ETF data confirmed $10.9 million in net inflows on September 2, extending the consecutive inflow streak to 11 trading days.
Get 3 Free Stock Ebooks
Discover top-performing stocks in AI, Crypto, and Technology with expert analysis.
- Top 10 AI Stocks - Leading AI companies
- Top 10 Crypto Stocks - Blockchain leaders
- Top 10 Tech Stocks - Tech giants



