


Key Highlights
- SOL has climbed 12% over the last month and currently trades near $77
- ETF inflows into Solana products reached a two-week peak, with BSOL attracting $5.83M
- Previously inactive wallets engaging with Solana DEXs jumped 400% within seven days
- Critical resistance level at $78 must be cleared; breaking $97.89 could trigger a move to $120–$130
- Technical indicators show a bullish MA crossover, indicating mounting buying momentum
Solana has delivered a 12% gain over the previous 30 days, establishing itself as the second-strongest performer among the top five cryptocurrencies by market capitalization. Currently, SOL is changing hands around $77, with 24-hour trading volume reaching $1.61 billion.
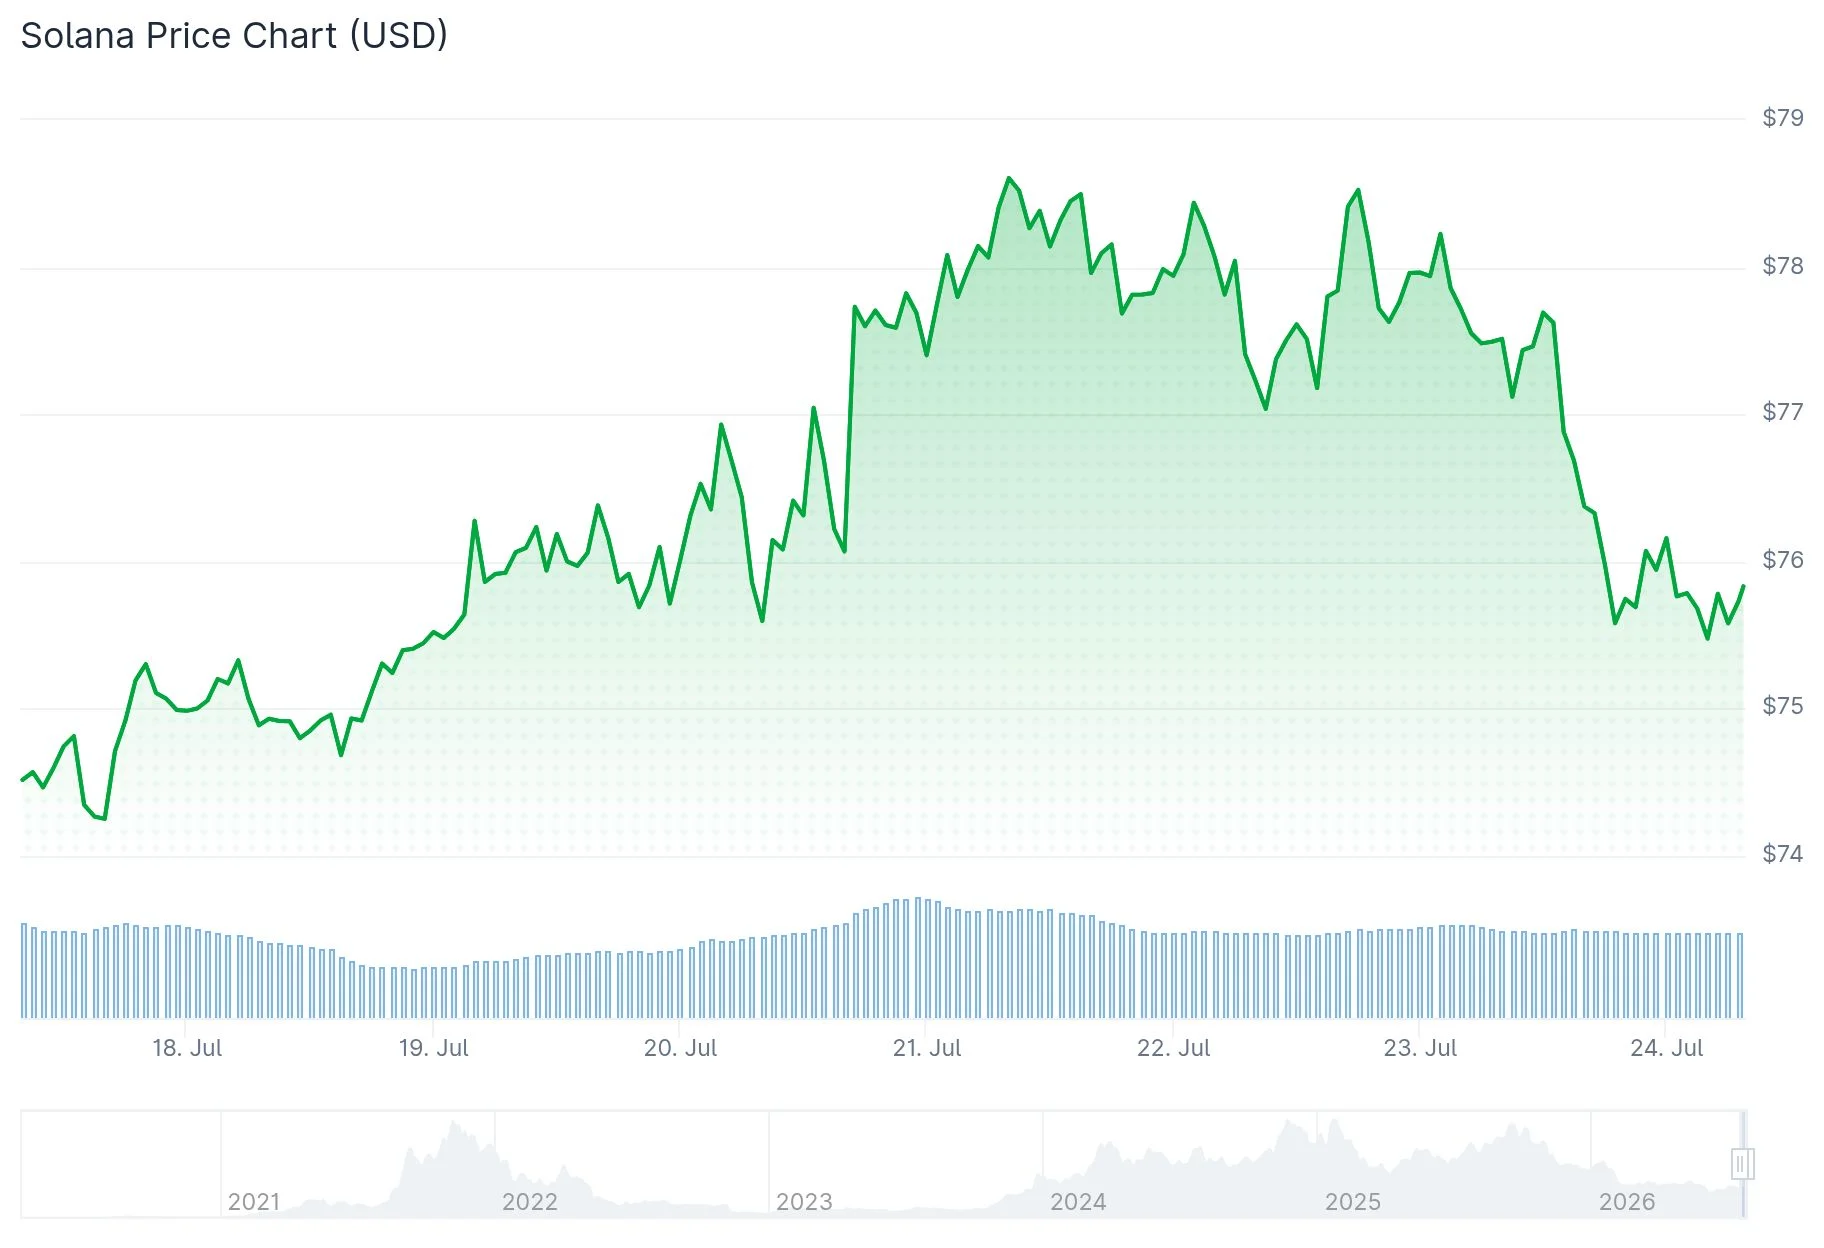
Daily trading activity has tapered somewhat from $2.2 billion down to $1.7 billion following four consecutive sessions of positive price action. The cryptocurrency appears to be consolidating after its recent climb.
Investment flows into Solana ETF products reversed course this week, with $7.2 million in net inflows recorded. Leading the charge was the Bitwise Solana Staking ETF (BSOL), which registered $5.83 million in inflows on July 21—marking the strongest single-day performance in a fortnight.
The day after, these funds experienced $1.27 million in withdrawals, representing approximately 25% of the previous day’s deposits. July has seen cumulative net inflows approaching $12 million, a sharp contrast to June’s $786,000 in net outflows.
However, July’s momentum trails May by 86%, when Solana ETFs attracted $115 million while SOL was trading around the $80 mark.

Inactive Wallets Make Comeback
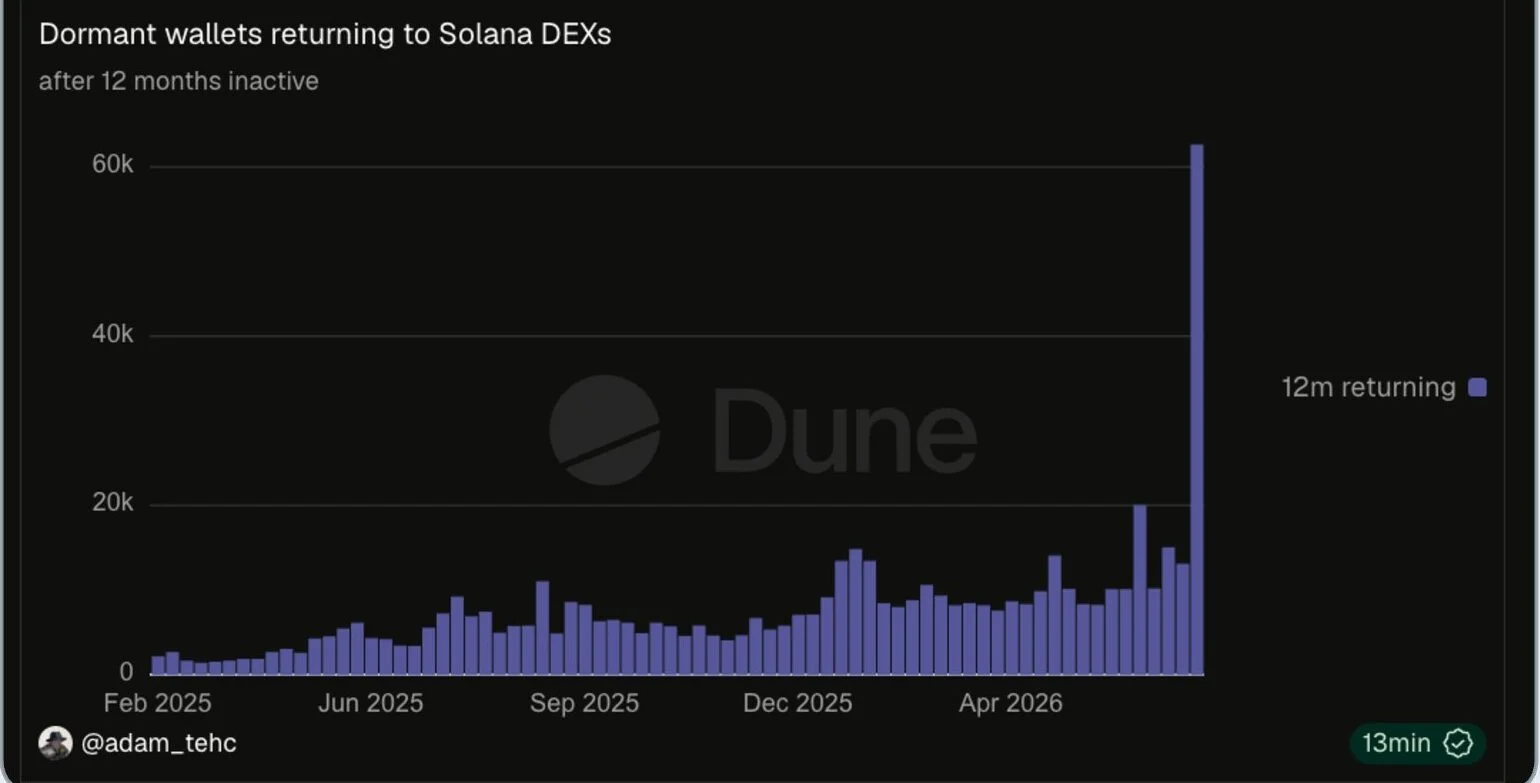
The number of previously dormant wallets re-engaging with Solana decentralized exchanges climbed to 62,000 last week, a dramatic increase from fewer than 20,000 the prior week. This represents a 400% surge and marks the highest level of returning user activity observed in more than twelve months.
Meanwhile, the stablecoin supply on Solana’s network has reached a fresh record high of $17 billion, based on data from DeFi Llama. Conversely, application fees across the network continue languishing at their lowest levels in two years.
Cryptocurrency analyst Michaël van de Poppe shared on X that SOL is “holding the range low” and forecasted that it’s “just a matter of time” before the asset pushes toward $120. Van de Poppe has identified the $75 zone as a critical support foundation.
Critical Resistance Zones Under Watch
Technical charts reveal a moving average crossover event, where the faster-moving average has climbed above its slower counterpart—a pattern that traders often interpret as a potential trend reversal signal. The Relative Strength Index is also positioned above the neutral threshold, indicating strengthening demand.
For SOL to transition from a bearish to bullish market structure, it must establish a daily close above $97.89. Until that threshold is breached, the technical trend remains negatively oriented.
Should Solana successfully penetrate the $78 resistance barrier, market observers are targeting the $90–$95 zone as the subsequent objective, which coincides with the current position of the 200-day exponential moving average. A decisive breakout beyond $97 could propel prices into the $120–$130 territory.
The Crypto Fear and Greed Index currently reads 39, hovering near Neutral territory. More than half of the analysts monitored by FedWatch anticipate a 25 basis point interest rate increase from the Federal Reserve by September, which may constrain upside potential for alternative cryptocurrencies in the immediate term.
Solana and Hyperliquid ETF products collectively represent almost 80% of all non-Bitcoin/Ethereum ETF trading volume, with Solana ETF assets under management now nearing the $1 billion milestone.
Get 3 Free Stock Ebooks
Discover top-performing stocks in AI, Crypto, and Technology with expert analysis.
- Top 10 AI Stocks - Leading AI companies
- Top 10 Crypto Stocks - Blockchain leaders
- Top 10 Tech Stocks - Tech giants



