



Key Highlights
- Fear and uncertainty surrounding Solana have climbed to their peak levels in 2026 while trade volumes sink to annual lows
- A critical resistance barrier sits between $79 and $85 where approximately 105 million SOL tokens previously traded
- Successfully clearing $85 may pave the way toward $100 and subsequently $127; failure could trigger declines to $53 or deeper
- Network fundamentals remain robust with Q2 showcasing impressive performance across vital metrics
- Market analyst Michaël van de Poppe emphasizes the importance of maintaining the $73–$76 support zone for upward momentum
Solana currently confronts unprecedented levels of market skepticism and uncertainty in 2026. Concurrently, trading activity has plummeted to its yearly nadir, data from blockchain intelligence firm Santiment reveals.
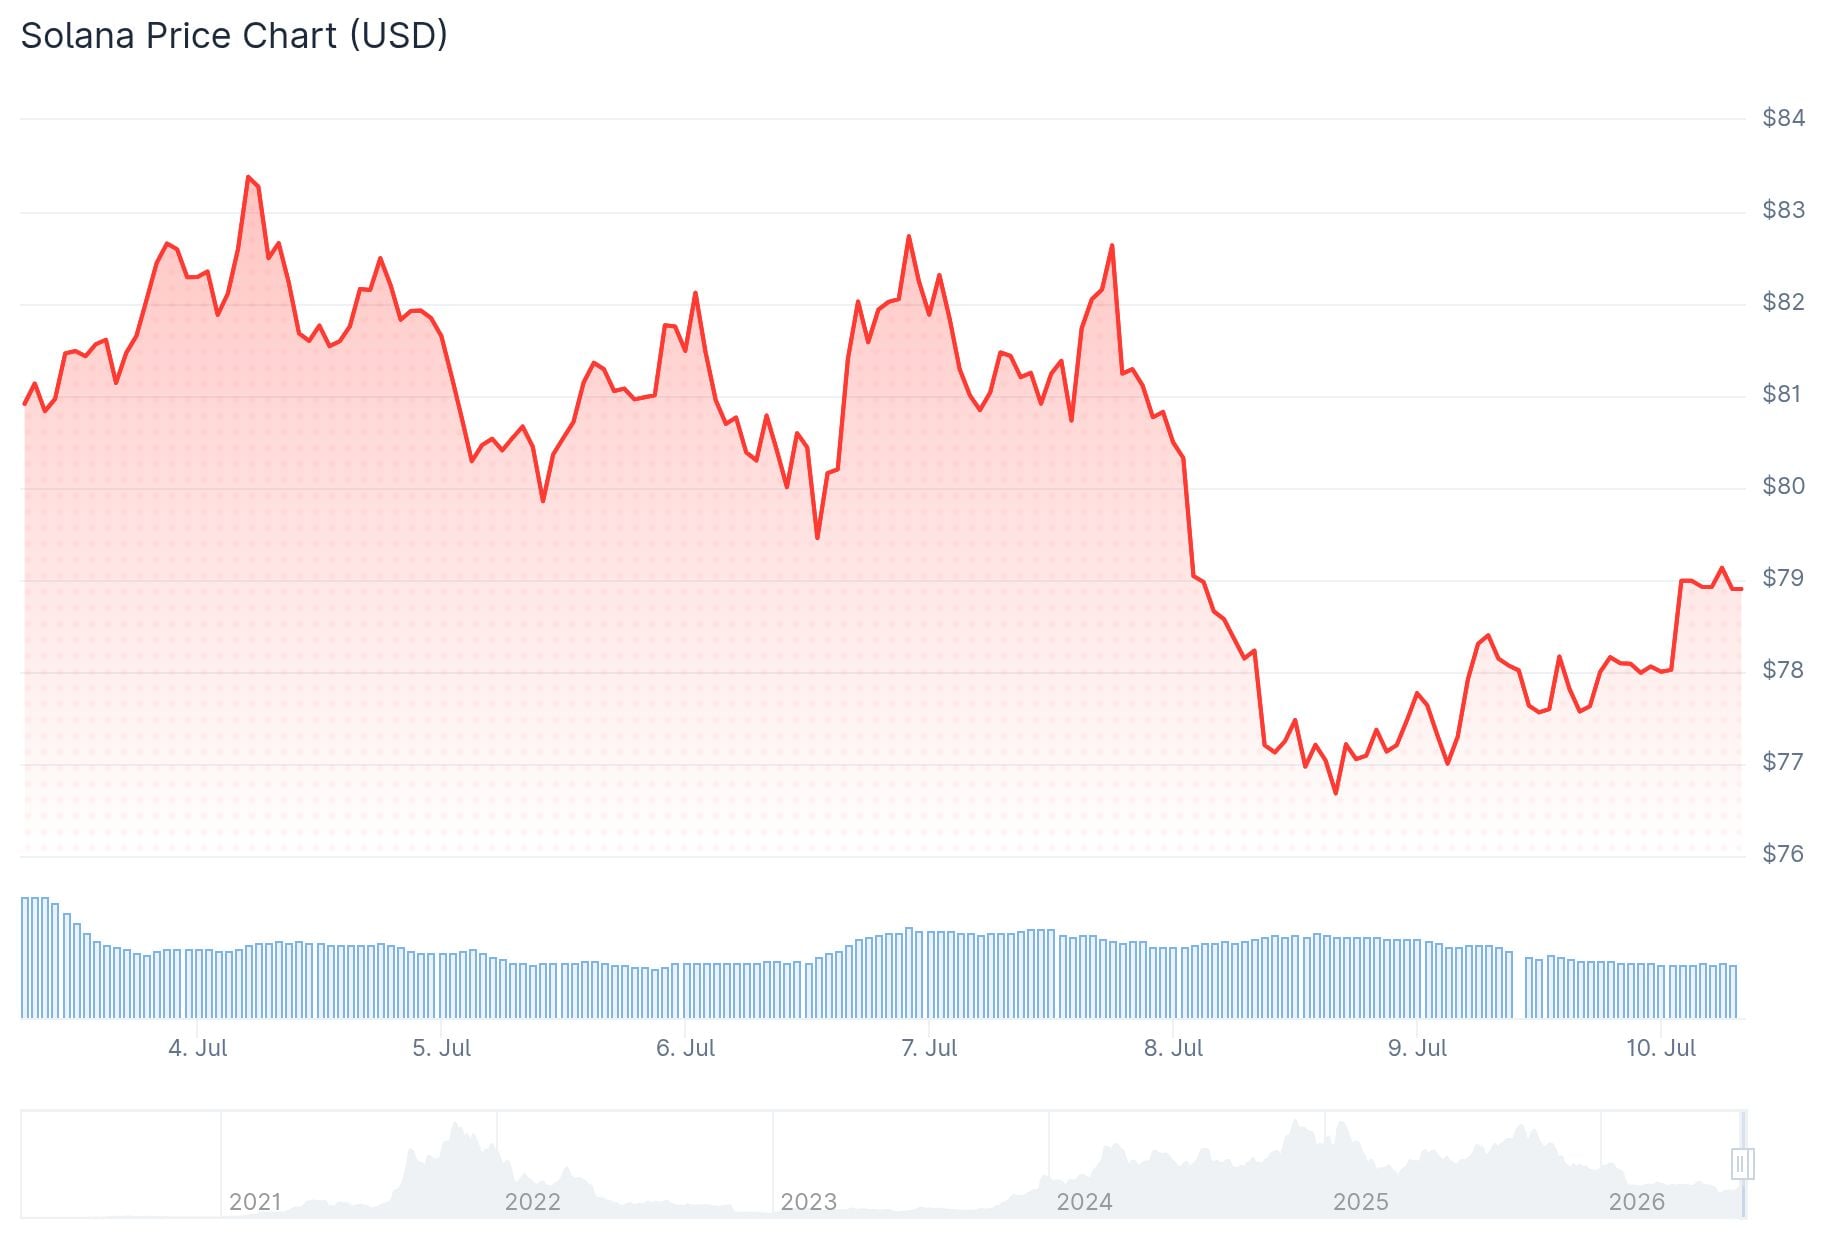
Market participants have adopted a notably defensive stance. Disappointment has mounted following SOL’s inability to deliver anticipated price performance, even amid buzz surrounding tokenized equities and tangible asset integration on its blockchain.
Santiment observed that the convergence of bearish sentiment with diminished trading volumes occasionally weakens selling pressure. This environment potentially enables institutional investors to accumulate positions with minimal market friction.
Trading expert Michaël van de Poppe commented via X that maintaining stability within the $73 to $76 corridor followed by a rebound would signal substantial bullish momentum capable of surpassing $100. He cautioned that losing this critical support could catalyze widespread declines throughout the market.
Critical Resistance Zone Challenges SOL Bulls
Market analyst Ali Charts pointed out that approximately 105 million SOL tokens exchanged ownership within the $79–$85 price corridor. This concentration creates formidable selling pressure, as numerous holders approaching their entry points may seek exits.

Should buyers successfully breach $85 and establish it as a foundation, price objectives shift to $100 followed by $127. Conversely, rejection at these levels could precipitate a retreat toward $53, with additional support concentrated between $45 and $36.
Analyst Astekz similarly identified $45.60 and $36.64 as significant downside objectives should SOL surrender its present trading range.
Network Fundamentals Contrast Price Pessimism
Notwithstanding prevailing bearish sentiment, Solana’s second-quarter blockchain metrics painted a contrasting picture. The platform facilitated approximately 100 million transactions daily. Average daily active wallets reached 1.93 million, while decentralized exchange volume averaged $2.09 billion per day.
Decentralized applications operating on Solana produced $262 million in quarterly revenue. This achievement represented the ninth consecutive quarter where Solana maintained its leadership position among blockchains in Web3 application revenue, capturing 41% of the aggregate total.
Tokenized real-world assets deployed on the network expanded from $2 billion in March to surpass $3.48 billion by July. Stablecoin transaction volume climbed to $1.79 trillion throughout June, reflecting a 63% surge from May figures.
Pump.fun contributed $91.43 million in revenue during the second quarter. The beginning of July witnessed a milestone week with transaction volume exceeding one billion non-vote operations on the network.
SOL presently navigates between compelling blockchain fundamentals and hesitant market sentiment, with the $79–$85 supply concentration representing the pivotal level demanding attention.
Get 3 Free Stock Ebooks
Discover top-performing stocks in AI, Crypto, and Technology with expert analysis.
- Top 10 AI Stocks - Leading AI companies
- Top 10 Crypto Stocks - Blockchain leaders
- Top 10 Tech Stocks - Tech giants



