


Key Takeaways
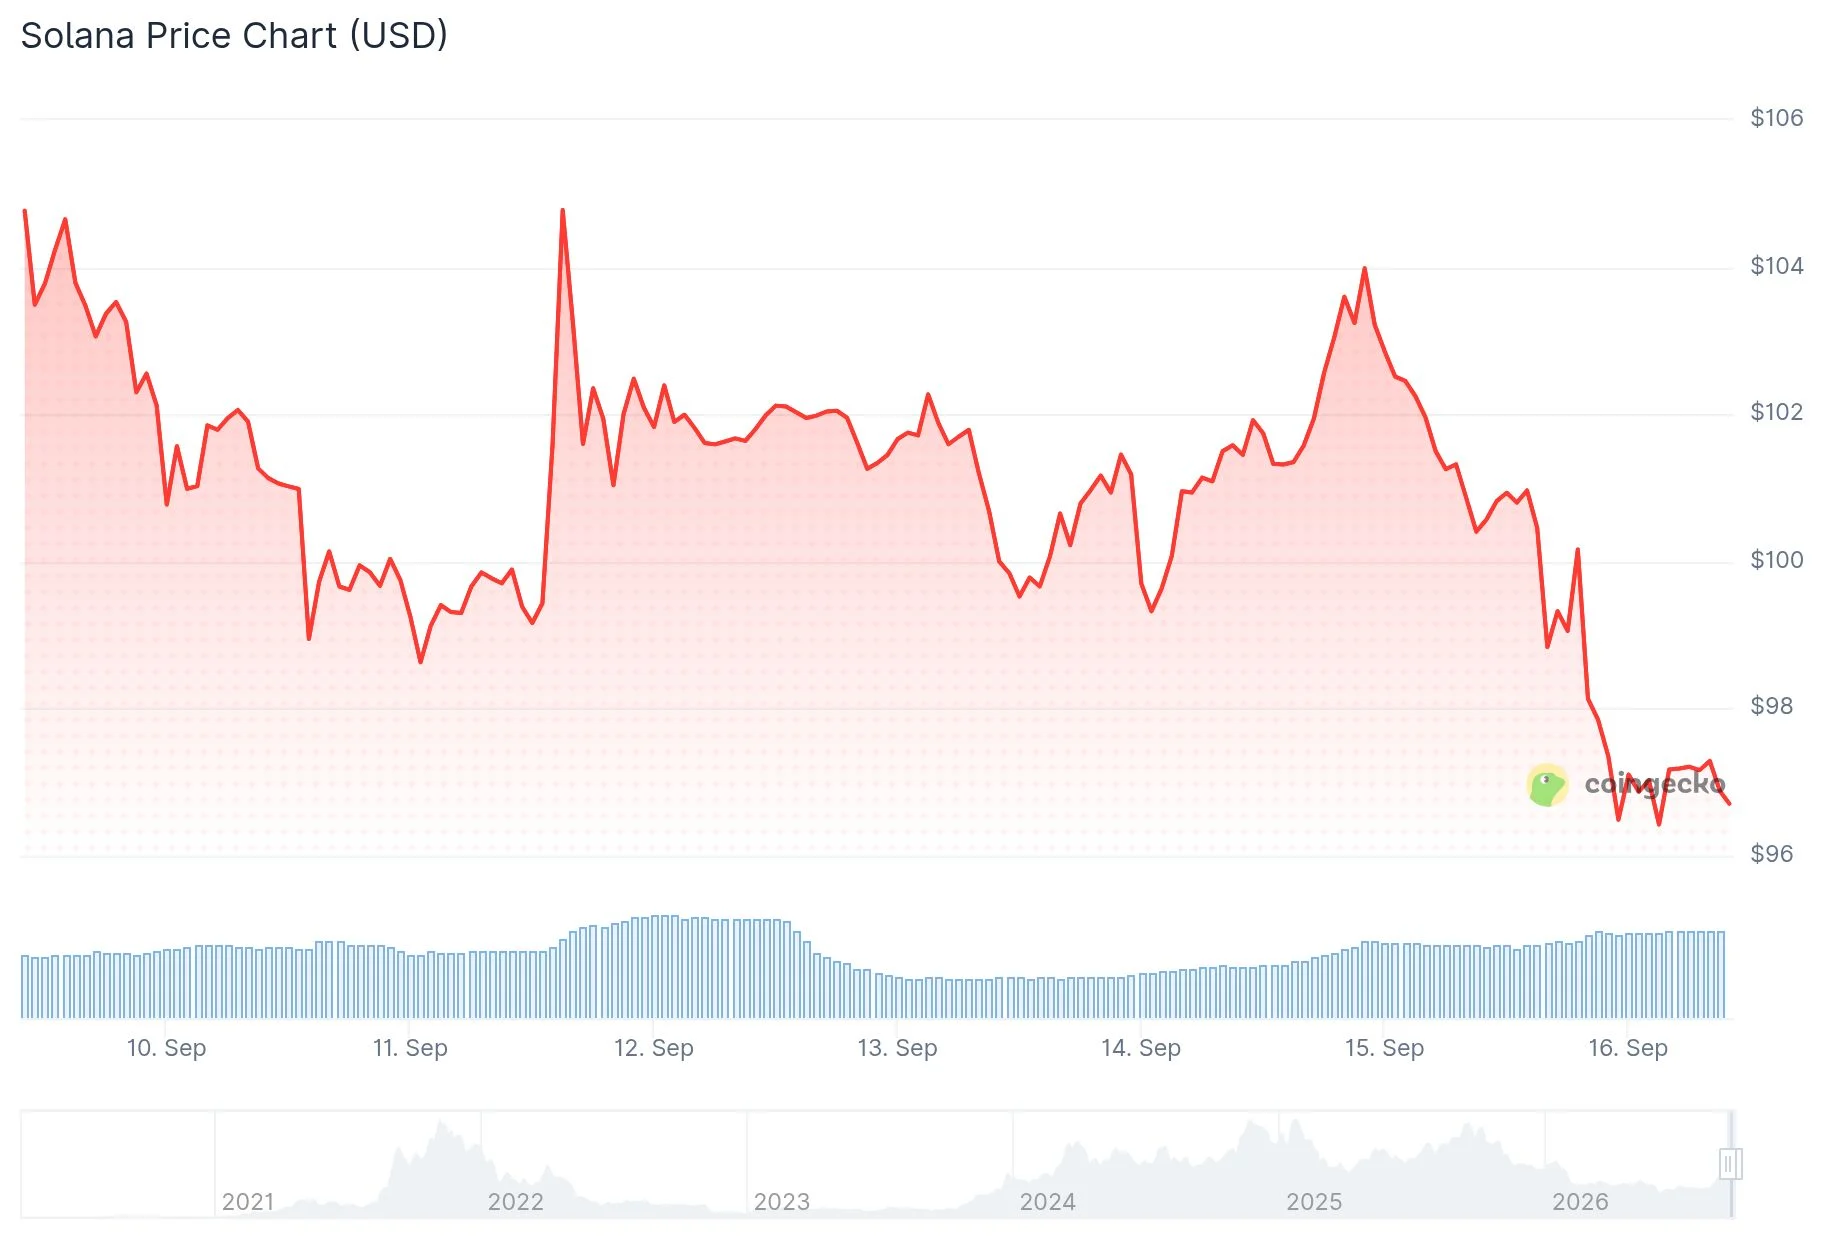
- Solana declined 3.37% to $96.97 as uncertainty surrounding the Senate CLARITY Act vote weighed on sentiment
- The legislation requires 60 Senate votes to proceed, meaning at least 7 bipartisan votes are necessary for passage
- Technical analysis suggests bearish momentum continues, with a 64% likelihood of additional downside
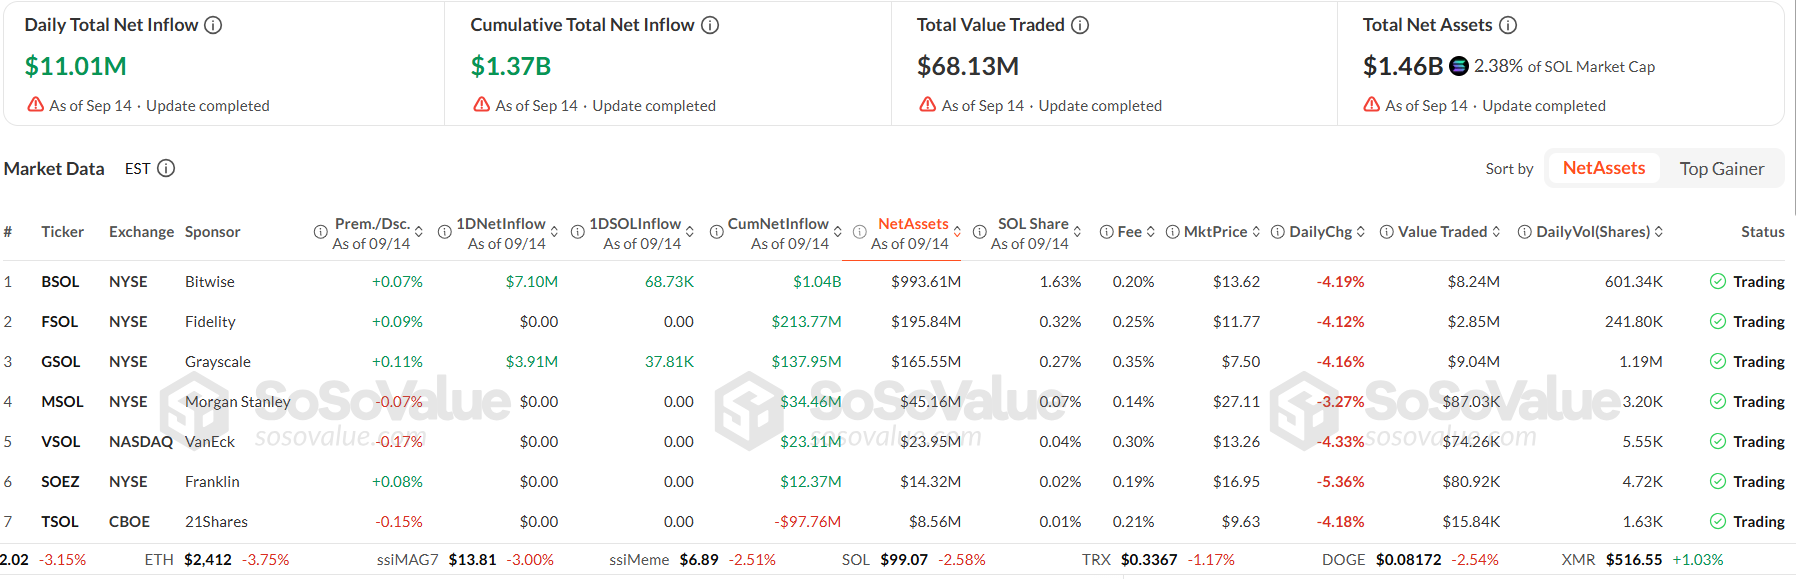
- Daily Solana ETF inflows reached $11.01 million on September 14, with Bitwise’s BSOL leading contributions
- Broader crypto ETF market recorded $1.3 billion in weekly inflows, extending positive flow streak to six weeks
Solana (SOL) experienced a 3.37% decline to $96.97 as markets braced for the U.S. Senate’s scheduled vote on the CLARITY Act, set for September 15 at 2:15 p.m. ET. The outcome of this vote carries significant implications for whether Solana and comparable digital assets will be categorized as digital commodities subject to SEC and CFTC regulation.
Passage of the bill demands 60 Senate votes to move forward to floor debate. Given that Republicans hold 53 Senate seats, securing bipartisan support from at least seven Democratic or independent senators becomes essential to overcome the procedural threshold.
Market participants adopted a cautious stance in anticipation of the vote, sending SOL beneath the psychologically significant $100 threshold. The cryptocurrency market at large declined 0.79%, bringing total market capitalization to $2.63 trillion.
Anton Kharitonov, technical analyst at Traders Union, characterized SOL’s current position as “technically weak,” citing persistent bearish pressure. He noted: “Until SOL breaks above $100.32 and legislative clarity is confirmed, I remain defensive and uninterested in upside exposure.” His outlook anticipates lateral or declining price movement as technical and regulatory uncertainties continue to impact the asset.
Critical Technical Thresholds
SOL currently trades beneath its 20-day moving average at $100.51 and 50-day moving average at $101.38, with both serving as immediate resistance barriers. The 200-day moving average at $83.30 provides long-term structural support from below. The Relative Strength Index registers 33.81, while Stochastic RSI, CCI, and Bull/Bear Power indicators all reflect oversold conditions.

The anticipated short-term price corridor spans $92.51 to $101.43. A breakdown below $92.51 could trigger intensified selling activity, whereas a definitive close above $100.32 would be required to indicate any bullish momentum shift.
Meanwhile, technical analyst Trader Tardigrade observed on X that SOL had made contact with the lower boundary of a bull flag formation on the daily timeframe, indicating the pattern could still facilitate upward movement if current price levels maintain.
ETF Demand Provides Underlying Strength
Notwithstanding the downward price pressure, Solana ETFs attracted $11.01 million in net daily inflows on September 14. Bitwise’s BSOL product dominated with $7.10 million, while Grayscale’s GSOL contributed $3.91 million. Aggregate Solana ETF inflows have reached $1.37 billion, with total net assets standing at $1.46 billion.
The wider cryptocurrency ETF sector demonstrated resilience as well. Weekly aggregate inflows totaled $1.3 billion, representing the sixth consecutive week of positive fund flows. Cumulative inflows during this stretch reached $6.8 billion, with BlackRock’s IBIT product alone contributing $3.4 billion.
For SOL to mount a recovery, bulls require a verified four-hour candle close above $110. Should the $100 level fail to hold, the next logical target becomes $95, which provided support during the late-August rebound.
Get 3 Free Stock Ebooks
Discover top-performing stocks in AI, Crypto, and Technology with expert analysis.
- Top 10 AI Stocks - Leading AI companies
- Top 10 Crypto Stocks - Blockchain leaders
- Top 10 Tech Stocks - Tech giants



