



Key Highlights
- Solana closed its first positive monthly candle in 10 months following a rebound from the $60 level
- The monthly RSI has breached a two-year descending trendline; MACD nears bullish crossover territory
- Large-scale investor accumulated 285,503 SOL tokens valued at $28.82 million across three weeks via Hyperliquid
- Daily chart golden cross formation triggers analyst projections of a possible rally beyond $150
- Solana’s Real World Asset ecosystem reached an all-time high of $4.35 billion while dominating 67% of multichain memecoin trading volume
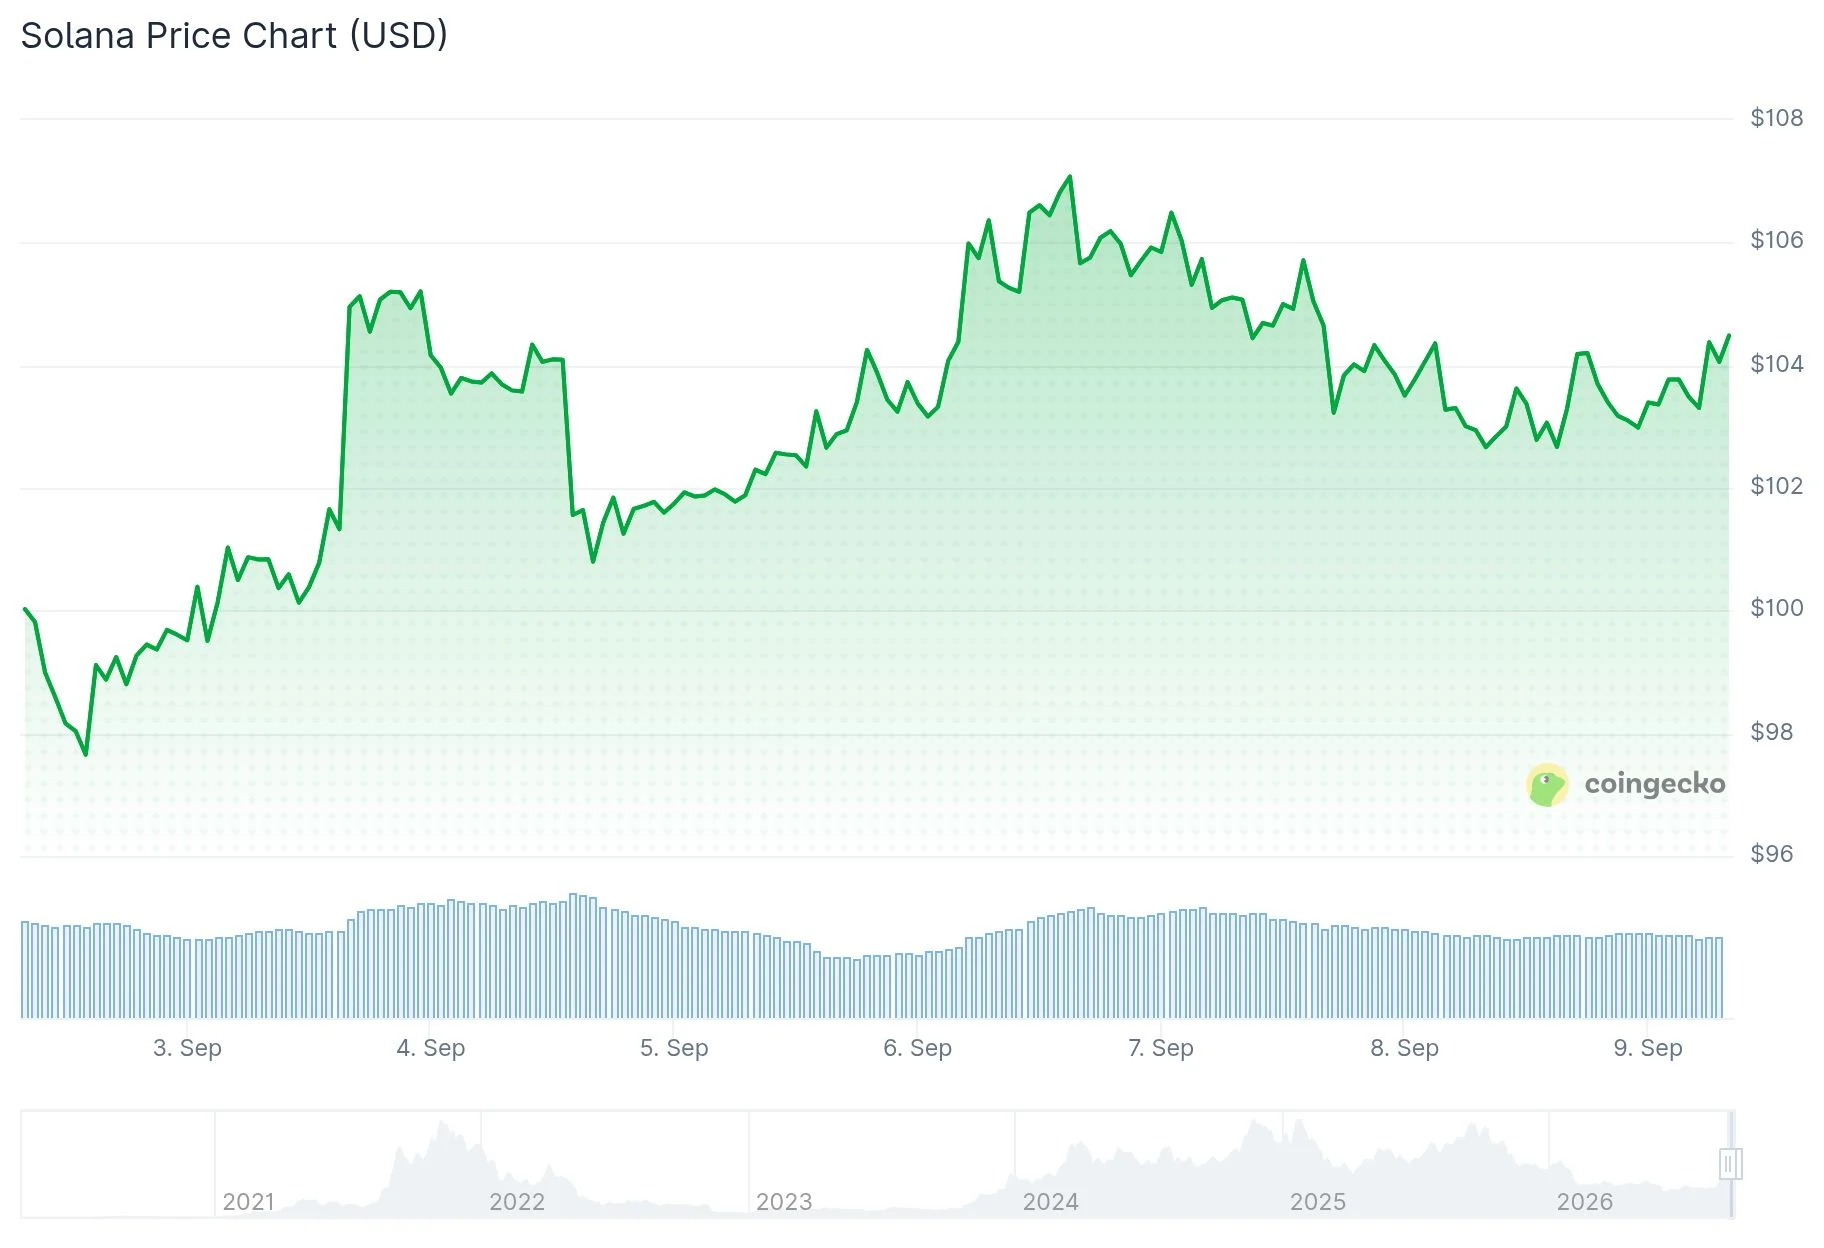
Solana (SOL) is currently changing hands around $102, reflecting a 3% decline in the last 24 hours. However, looking at the broader picture, SOL has surged 34.8% throughout the past month. The daily trading range spans from $102.28 to $105.20.
Another key indicator is the monthly MACD indicator, which appears to be nearing a bullish crossover pattern. This crossover remains unconfirmed at present. Additionally, the monthly RSI has successfully broken through a descending trendline that had constrained price action for approximately two years.
Crypto analyst Ash Crypto shared on X: “$SOL is showing one of the most bullish setups in crypto right now. Closed its first green monthly candle in 10 months. Monthly MACD is about to cross bullish. Monthly RSI has broken a 2 year downtrend. Is SOL starting its major bullish reversal?” While the analyst avoided declaring a definitive confirmation, they emphasized the notable transformation in momentum dynamics.
SOL had previously climbed above $200 before declining toward the $60 mark. Maintaining support within the $60 to $80 range would help preserve the current recovery framework. Breaking decisively through $100 to $120 would add further credibility to the bullish scenario.
Large Investor Accumulation Activity
Blockchain analytics reveal that whale wallet HURDw executed consistent SOL purchases through Hyperunit’s hot wallet spanning three weeks. The cumulative acquisition totaled 285,503 SOL tokens worth roughly $28.82 million. The biggest individual transaction involved 49,732 SOL, representing approximately $5.07 million in value.

These purchases were distributed across numerous transactions instead of a single bulk order, and the accumulation period coincided with SOL’s recovery phase from its bottom near $60.
Daily Chart Golden Cross Signals Potential $150 Target
Market analyst 0xSweep highlighted a newly formed golden cross pattern on Solana’s daily timeframe chart. This technical pattern materializes when a shorter-duration moving average rises above a longer-duration one.
0xSweep drew parallels between this crossover and an earlier occurrence on the identical chart, following which SOL rallied approximately 56.22% to reach the $250 zone. Extrapolating the same percentage gain from present price levels suggests a theoretical target exceeding $150 by October’s conclusion. This projection stems from historical pattern analysis rather than representing a guaranteed price destination.
Solana’s Real World Asset ecosystem achieved a fresh all-time high of $4.35 billion in aggregate value, supported by more than 420,000 RWA holders across the network. On September 7, Solana commanded 67% of spot decentralized exchange memecoin volume among monitored blockchains, representing nearly triple Robinhood’s 23% market share.
Get 3 Free Stock Ebooks
Discover top-performing stocks in AI, Crypto, and Technology with expert analysis.
- Top 10 AI Stocks - Leading AI companies
- Top 10 Crypto Stocks - Blockchain leaders
- Top 10 Tech Stocks - Tech giants



