



Key Takeaways
- Ethereum currently trades in the $1,910–$1,918 range, maintaining support above the critical $1,900 threshold
- Spot Ethereum ETFs in the United States registered $92.15 million in net inflows on August 6, pushing weekly totals to $244.94 million—the strongest performance in nearly four months
- ETH has climbed above its 20, 50, and 100-day moving averages, though it still trades beneath the 200-day moving average positioned at $2,061
- A disappointing US employment report reduced Federal Reserve rate hike expectations, providing support for risk-on assets like cryptocurrencies
- Market analysts identify $2,000 as the critical resistance level, with $1,900 serving as the dividing line for near-term bullish or bearish momentum
Ethereum currently hovers between $1,910 and $1,918. The digital asset has maintained its position above the psychologically significant $1,900 mark following a consistent upward trajectory throughout the week.
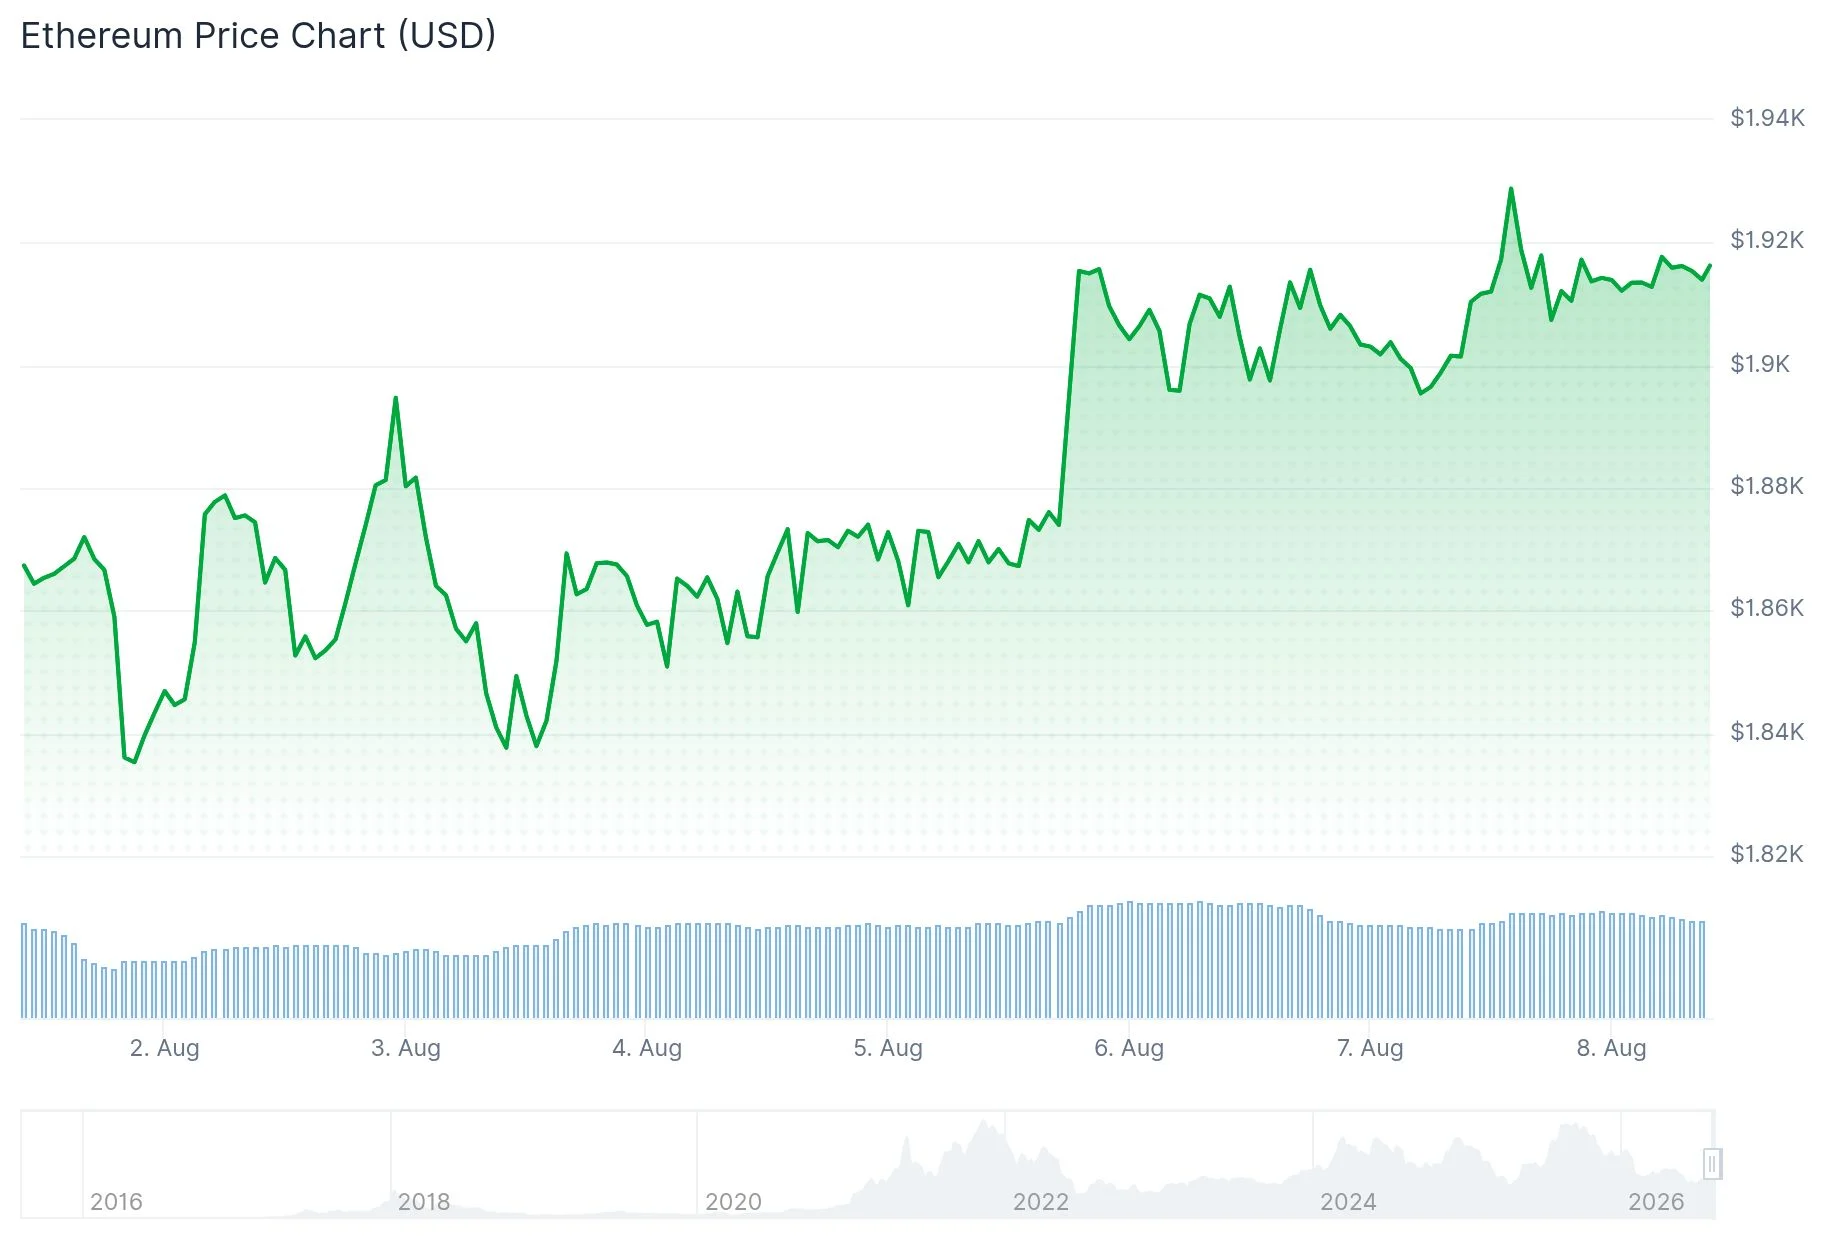
ETH has registered gains exceeding 4% over the seven-day period. Market participants have successfully protected the $1,840–$1,850 zone since August began, preventing any significant downward correction.
The asset now trades above three crucial daily moving average indicators. ETH maintains its position above the 20-day moving average at $1,895, the 100-day at $1,911, and the 50-day at $1,796. However, the 200-day moving average at $2,061 remains overhead, representing a key resistance level that ETH has yet to reclaim.
The daily Bull Bear Power indicator has shifted into positive territory at 32.07, indicating buyers currently hold a slight advantage in market control.
Market analyst Ted Pillows shared his perspective on Twitter, highlighting that ETH ETFs accumulated $244.94 million worth of Ethereum over the past week—marking the most substantial weekly inflow period in nearly four months. He also observed that despite postponed voting on the Clarity Act, ETH demonstrates solid fundamentals. “If ETH manages to hold above this level, a rally to $2,000 could happen next,” he posted.

Institutional Demand and Employment Data Drive Price Action
Spot Ethereum exchange-traded funds in the United States attracted $92.15 million in net inflows on August 6. BlackRock’s ETHA product dominated the previous trading session with $50.34 million in fresh capital. Total cumulative net inflows into US-based spot ETH ETFs have now surpassed $11.4 billion.
Friday’s employment report from the United States provided additional momentum. The economy shed 23,000 positions in July, starkly contrasting with analyst expectations of approximately 80,000 job additions. This significant shortfall has diminished the likelihood of another Federal Reserve rate increase, with futures markets now assigning roughly a 56% probability to a pause at the September policy meeting.
The 4-hour Relative Strength Index registers at 61.74, positioned above its signal line while remaining below the 70 threshold that indicates overbought conditions. Momentum favors buyers without appearing overextended.
Leveraged Position Clusters Suggest $1,950 Target
The 3-day liquidation heatmap reveals concentrated leveraged positions around $1,925, with a more substantial accumulation zone spanning $1,945 to $1,955. These price levels could act as magnets for upward movement should buying pressure persist.
A decisive move through $1,925 would likely trigger liquidations of short positions, potentially accelerating price appreciation toward $1,950.
Analyst Michaël van de Poppe suggested Ethereum might outpace Bitcoin’s performance if BTC achieves an upward breakout. His extended price objective for ETH reaches approximately $2,400, though he emphasized that ETH must first overcome $2,000 and reclaim the 200-day moving average.
The immediate focus remains on $2,000. ETH concluded Friday’s session near $1,918, with $1,900 representing the critical support level that underpins the current short-term bullish thesis.
Get 3 Free Stock Ebooks
Discover top-performing stocks in AI, Crypto, and Technology with expert analysis.
- Top 10 AI Stocks - Leading AI companies
- Top 10 Crypto Stocks - Blockchain leaders
- Top 10 Tech Stocks - Tech giants



