



Key Highlights
- Ethereum has surged 30% from August 19 lows, now confronting critical resistance at the $2,500 mark
- Bitmine Chairman Tom Lee revealed his firm acquired 34,000 ETH, noting pattern similarities to historic rallies in 2021 and May 2025
- Binance funding rate for ETH reached 0.01, marking the highest reading in twelve months
- US-based spot Ethereum ETFs saw $1.06 billion in net inflows during August 2026, representing the strongest monthly performance in a year
- Large holders accumulated 182,000 ETH while smaller retail investors offloaded 207,000 ETH over the past week
The second-largest cryptocurrency by market capitalization has experienced a powerful upward move exceeding 30% from its August 19 bottom, bringing prices tantalizingly close to the psychologically significant $2,500 threshold. While momentum appears to be moderating, multiple technical and fundamental metrics continue to signal bullish potential.
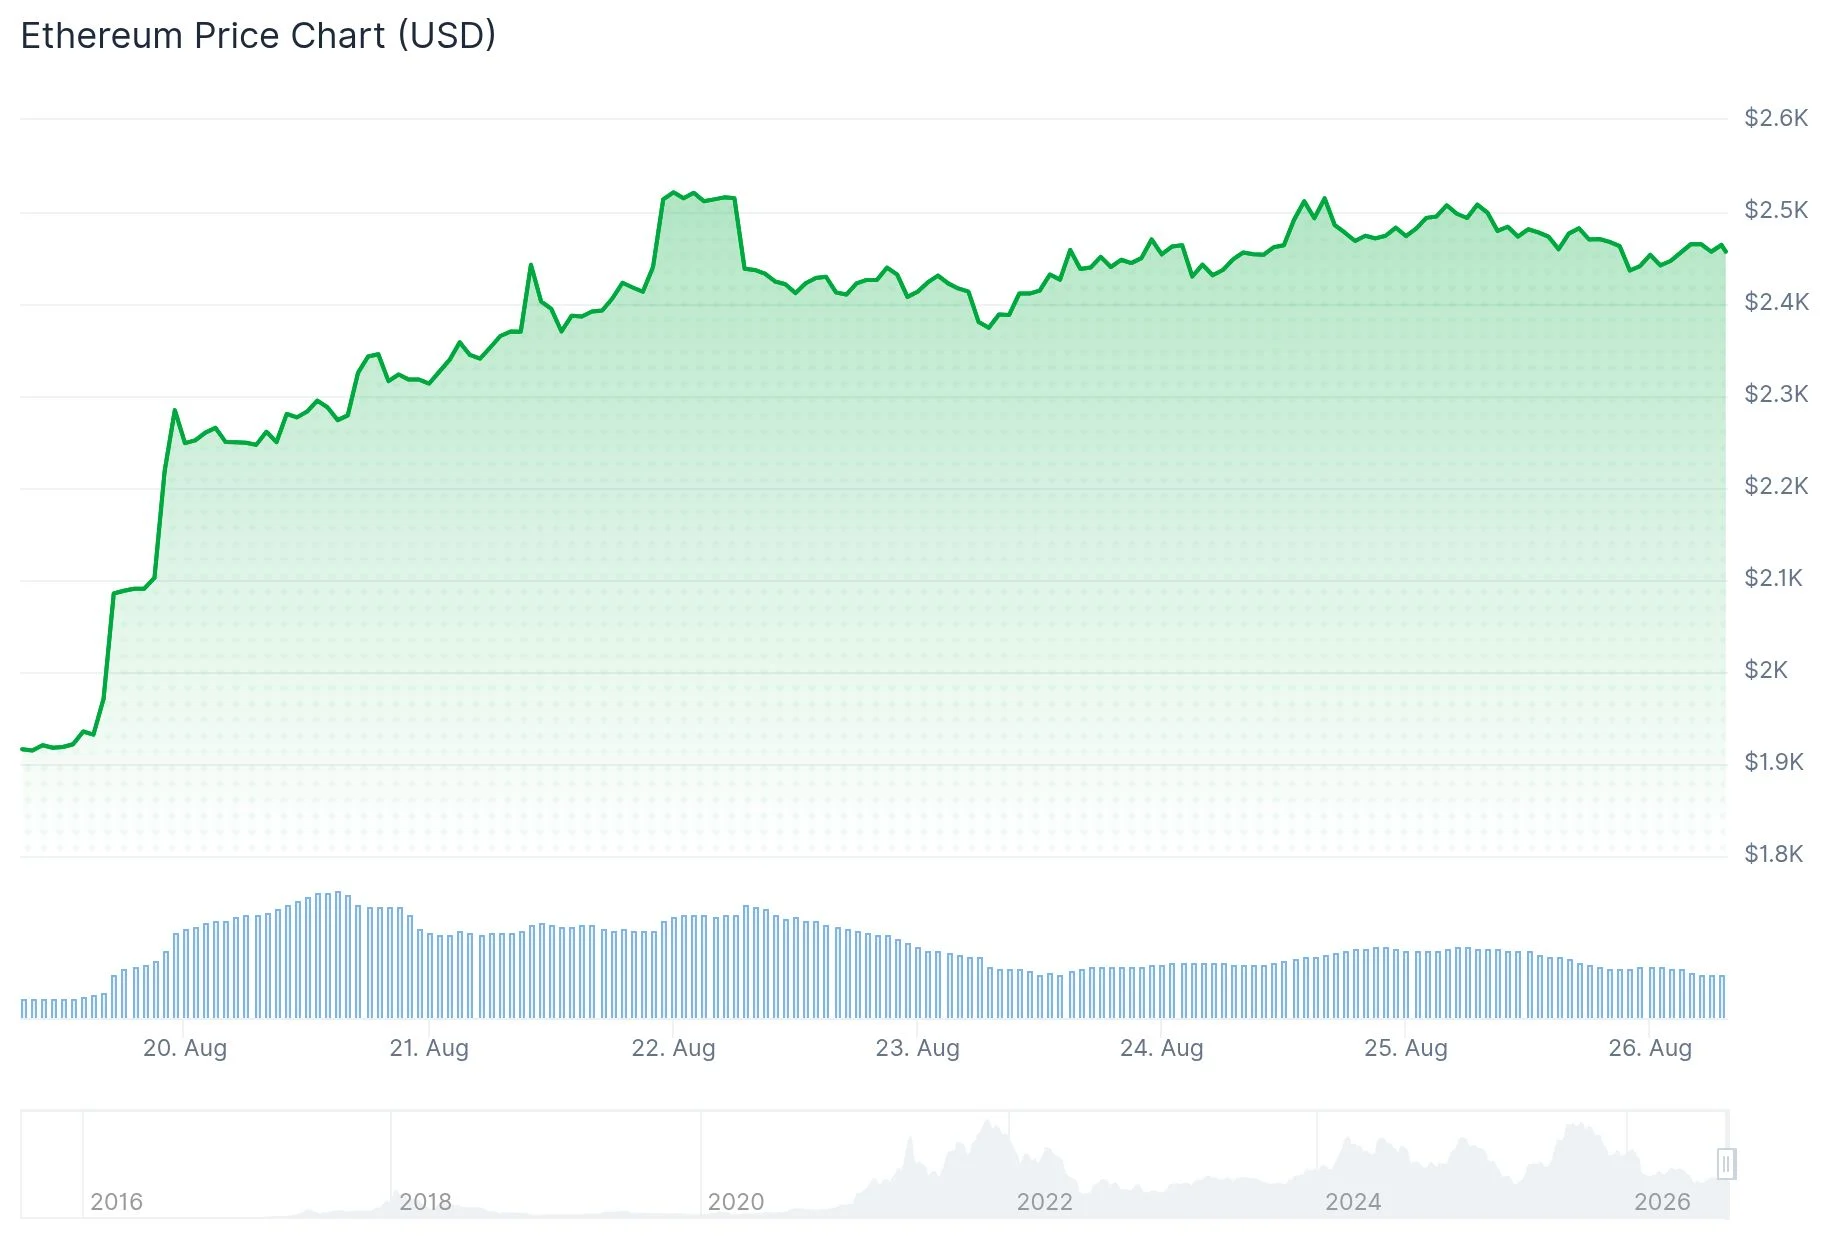
Bitmine Chairman Tom Lee made headlines by announcing his firm’s strategic accumulation of 34,000 ETH tokens during the five-day period spanning August 17 through August 21. In his analysis, Lee emphasized that Ethereum just completed its most impressive weekly percentage gain since May 2025.
Drawing historical parallels, Lee identified that comparable large weekly candlestick formations emerged during July 2021 and May 2025. Following those technical patterns, ETH proceeded to rally by 167% and 170% in subsequent moves.
The veteran analyst suggests macroeconomic tailwinds could provide additional support for continuation, specifically pointing to approximately $1 trillion in anticipated Treasury buyback programs that may inject substantial liquidity into markets and elevate demand for risk-oriented assets.
Market analyst Ash Crypto provided additional commentary via X (formerly Twitter), emphasizing that ETH delivered an impressive +31% weekly gain and achieved its highest weekly closing price since May 2025. His analysis focused on Ethereum’s current test of the Weekly 200-day Moving Average, which he characterized as “the most important line for trend reversal.” According to Ash Crypto’s framework, a decisive close above this technical level could unlock a path toward $2,800–$3,400, whereas rejection from current levels might trigger a retreat to $1,900 or potentially $1,500.

Derivatives Metrics and Blockchain Analytics
Analytics from CryptoQuant reveal that Ethereum’s funding rate on the Binance exchange has climbed to 0.01, representing the most elevated reading witnessed over the past twelve months. This positive funding rate indicates that traders maintaining long positions are compensating short sellers to keep their leveraged bets active.
Arab Chain, a CryptoQuant analyst, interpreted the ascending funding rate as evidence of strengthening risk appetite among market participants, with capital rotating toward spot market products.
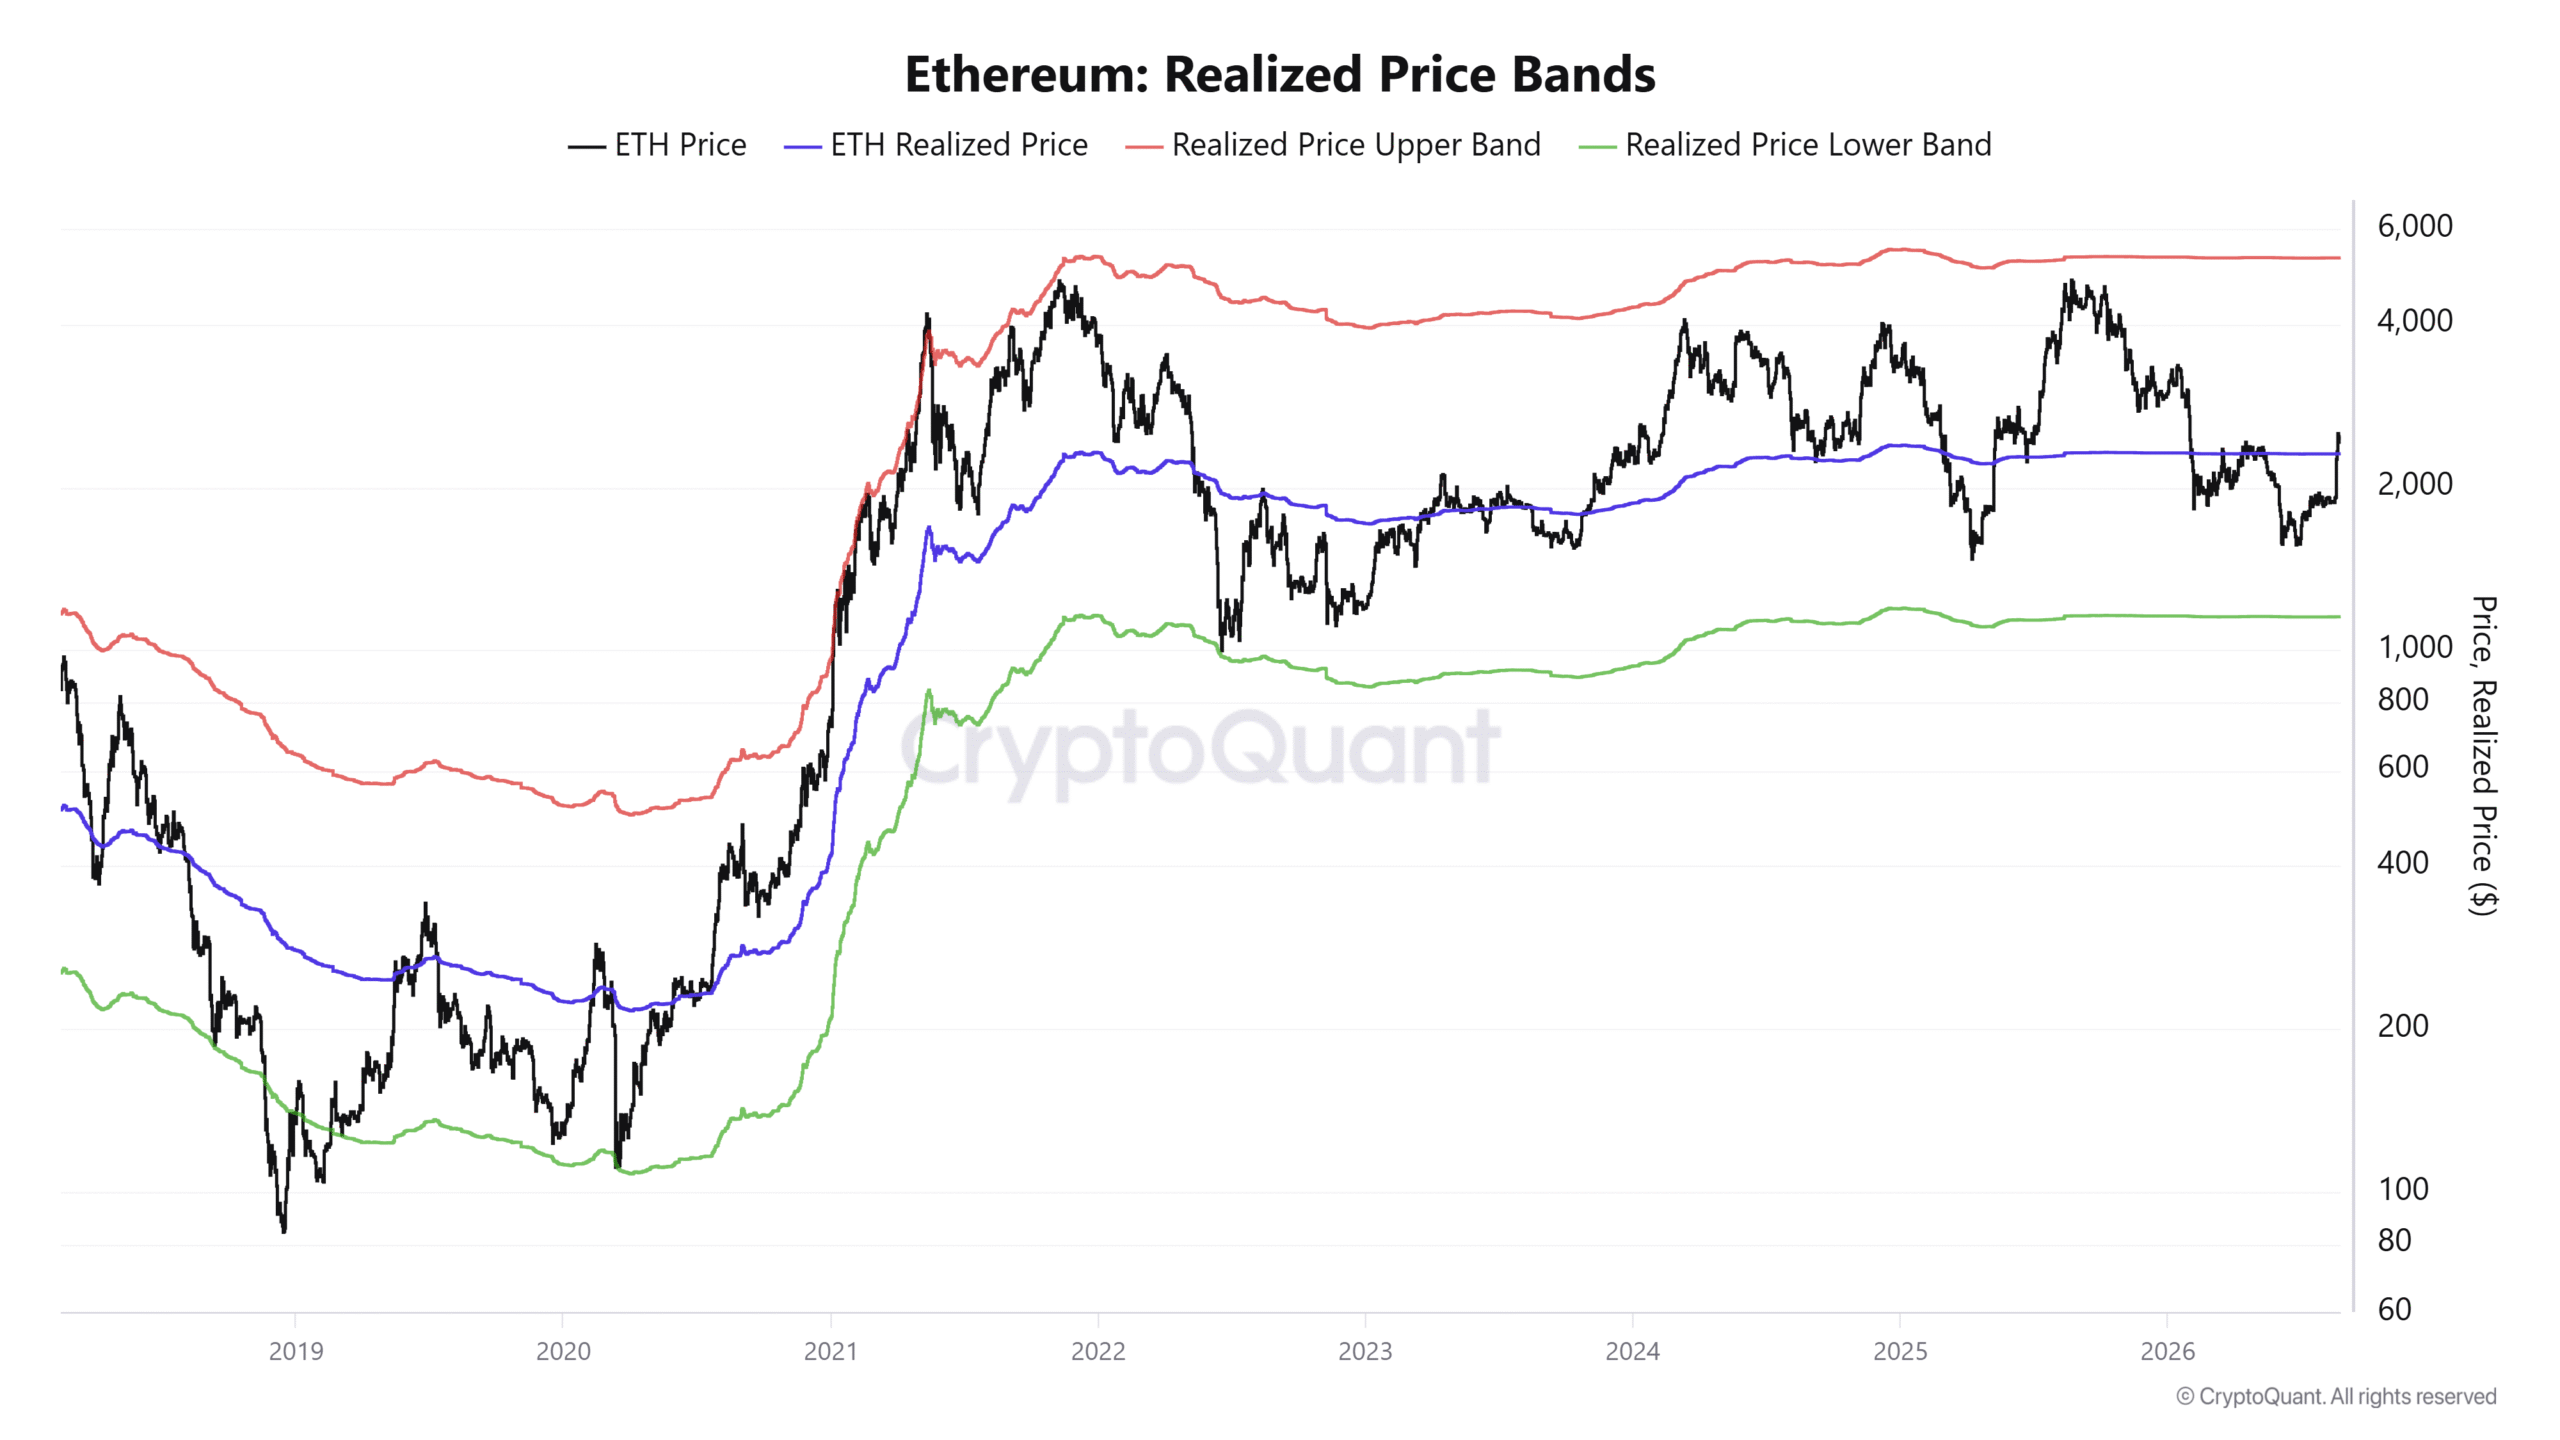
Blockchain data further demonstrates ETH successfully breached its realized price threshold of $2,306, a metric representing the aggregate average acquisition cost for all investors holding the asset. Distribution patterns show retail-sized wallets containing 100–1,000 ETH liquidated 207,000 tokens during the previous week, while larger wallets holding 10,000–100,000 ETH accumulated an additional 182,000 tokens.
Institutional Demand Through ETFs Reaches Annual Peak
United States-based spot Ethereum exchange-traded funds have attracted $1.06 billion in net inflows throughout August 2026 to date, establishing the strongest monthly performance since August 2025. BlackRock’s iShares Ethereum Trust dominated inflows with $814 million, while Fidelity’s Ethereum Fund captured $81 million in new capital.
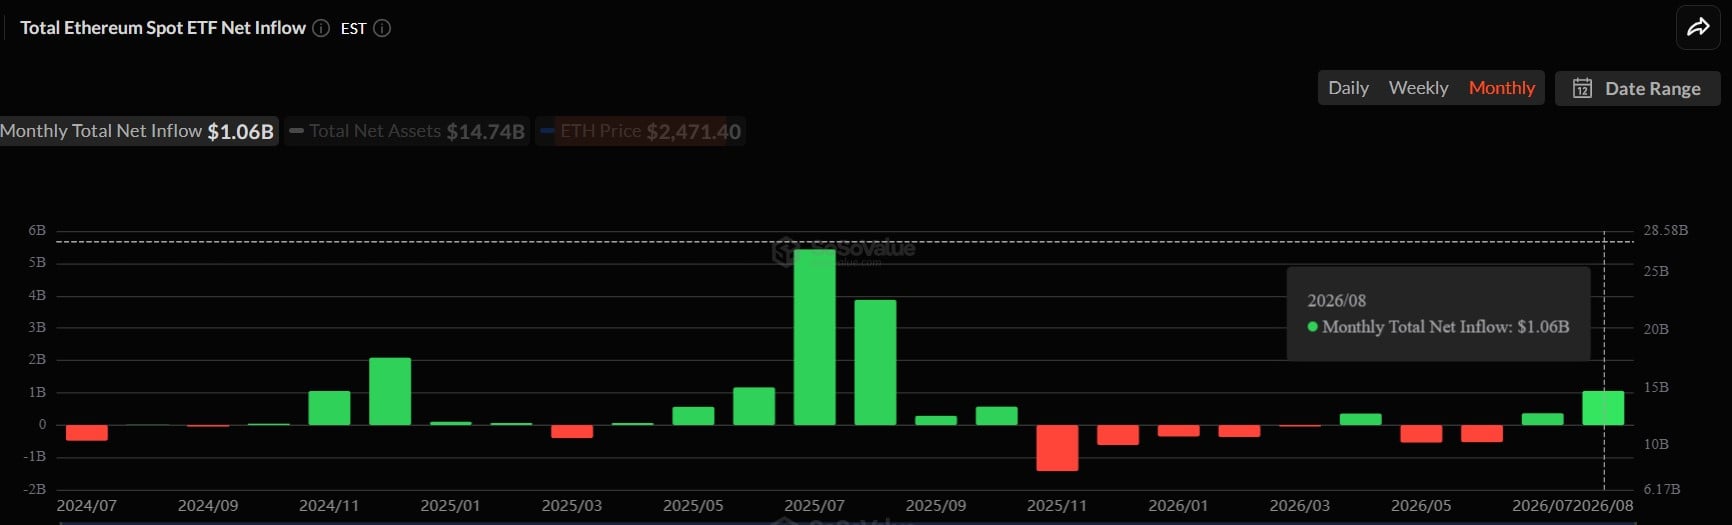
The collective ETH ETF ecosystem now manages $14.74 billion in total net assets, representing approximately 4.93% of Ethereum’s overall market capitalization.
Liquidation data shows $103.2 million in forced position closures occurred during the trailing 24-hour period, with $69 million stemming from bearish short positions. A technical golden cross pattern has materialized, characterized by the 20-day Exponential Moving Average crossing upward through the 200-day EMA.
Looking ahead, immediate resistance zones await at $2,678 and $2,865, while downside support is established at $2,431 with additional cushion from the 20-day EMA positioned near $2,162.
Get 3 Free Stock Ebooks
Discover top-performing stocks in AI, Crypto, and Technology with expert analysis.
- Top 10 AI Stocks - Leading AI companies
- Top 10 Crypto Stocks - Blockchain leaders
- Top 10 Tech Stocks - Tech giants



