



Key Takeaways
- ETH remains confined between $2,486 and $2,500, trapped in a narrow band for more than three weeks.
- Leveraged traders show limited conviction as open interest growth fails to match price appreciation.
- Spot Ethereum ETFs in the United States recorded $24.3 million in net outflows during Tuesday’s session.
- Critical resistance zone identified between $2,525 and $2,535; breakthrough could push toward $2,550–$2,600.
- Important support levels include $2,478, the $2,435–$2,445 area, and $2,350–$2,360.
Ethereum is currently changing hands around $2,486 as of September 9, maintaining a position just beneath the psychologically significant $2,500 threshold following multiple weeks of restricted movement. The digital asset has remained locked within a corridor spanning $2,431 to $2,544 without establishing a definitive directional move.
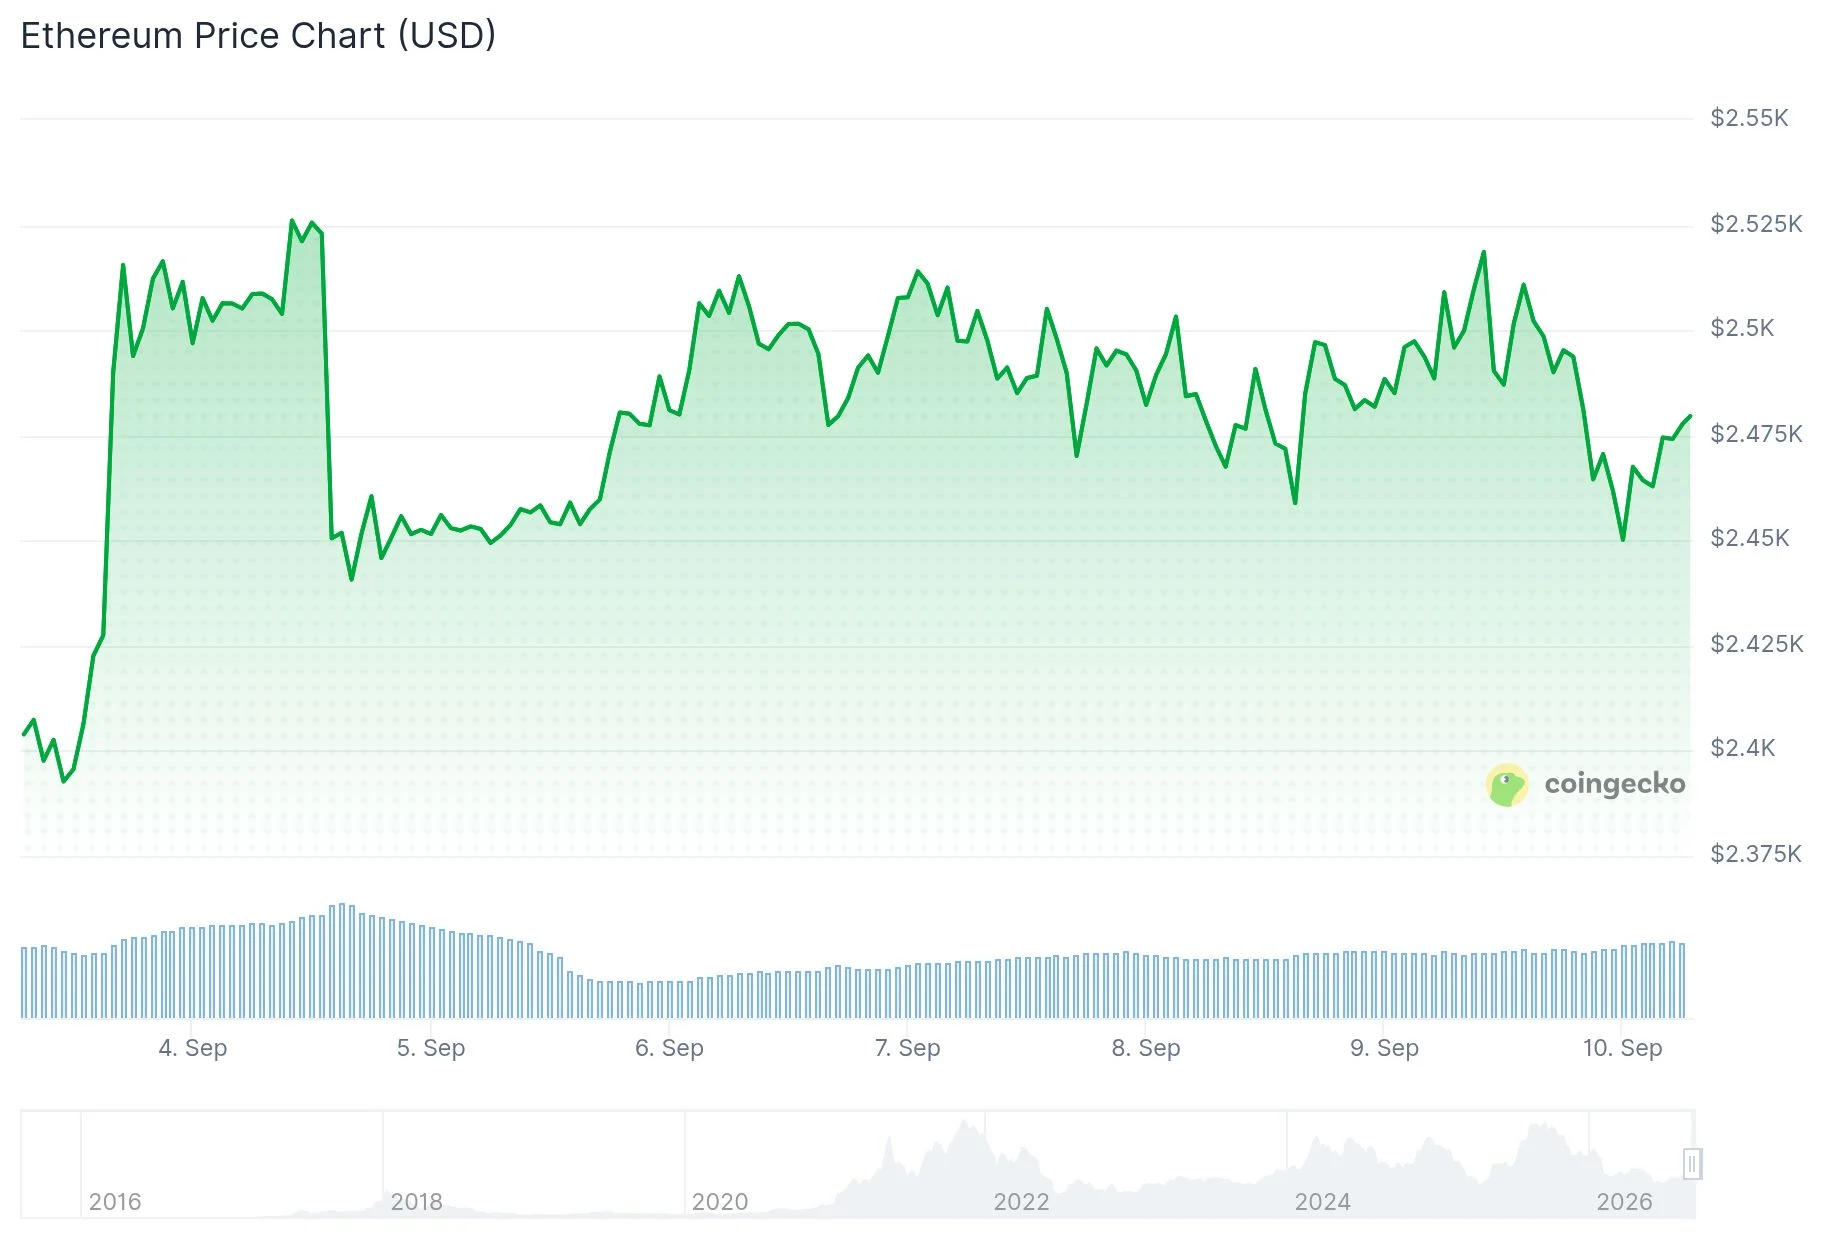
Purchasing activity has emerged consistently within the $2,478–$2,485 region, yet subsequent upward momentum has encountered resistance between $2,525 and $2,535. This overhead barrier has repeatedly contained upward price movements since Ethereum’s August advance.
The second-largest cryptocurrency by market capitalization continues trading above its 20-, 50-, 100-, and 200-day Exponential Moving Averages, maintaining a technically constructive overall structure. The 20-day EMA positioned near $2,403 represents the nearest dynamic floor beneath current price levels.
The 14-day Relative Strength Index hovers in the lower 60s, while the Stochastic Oscillator registers approximately 62. These metrics indicate demand exists but lacks sufficient strength to drive a decisive breakout.
Futures Market Reflects Limited Confidence
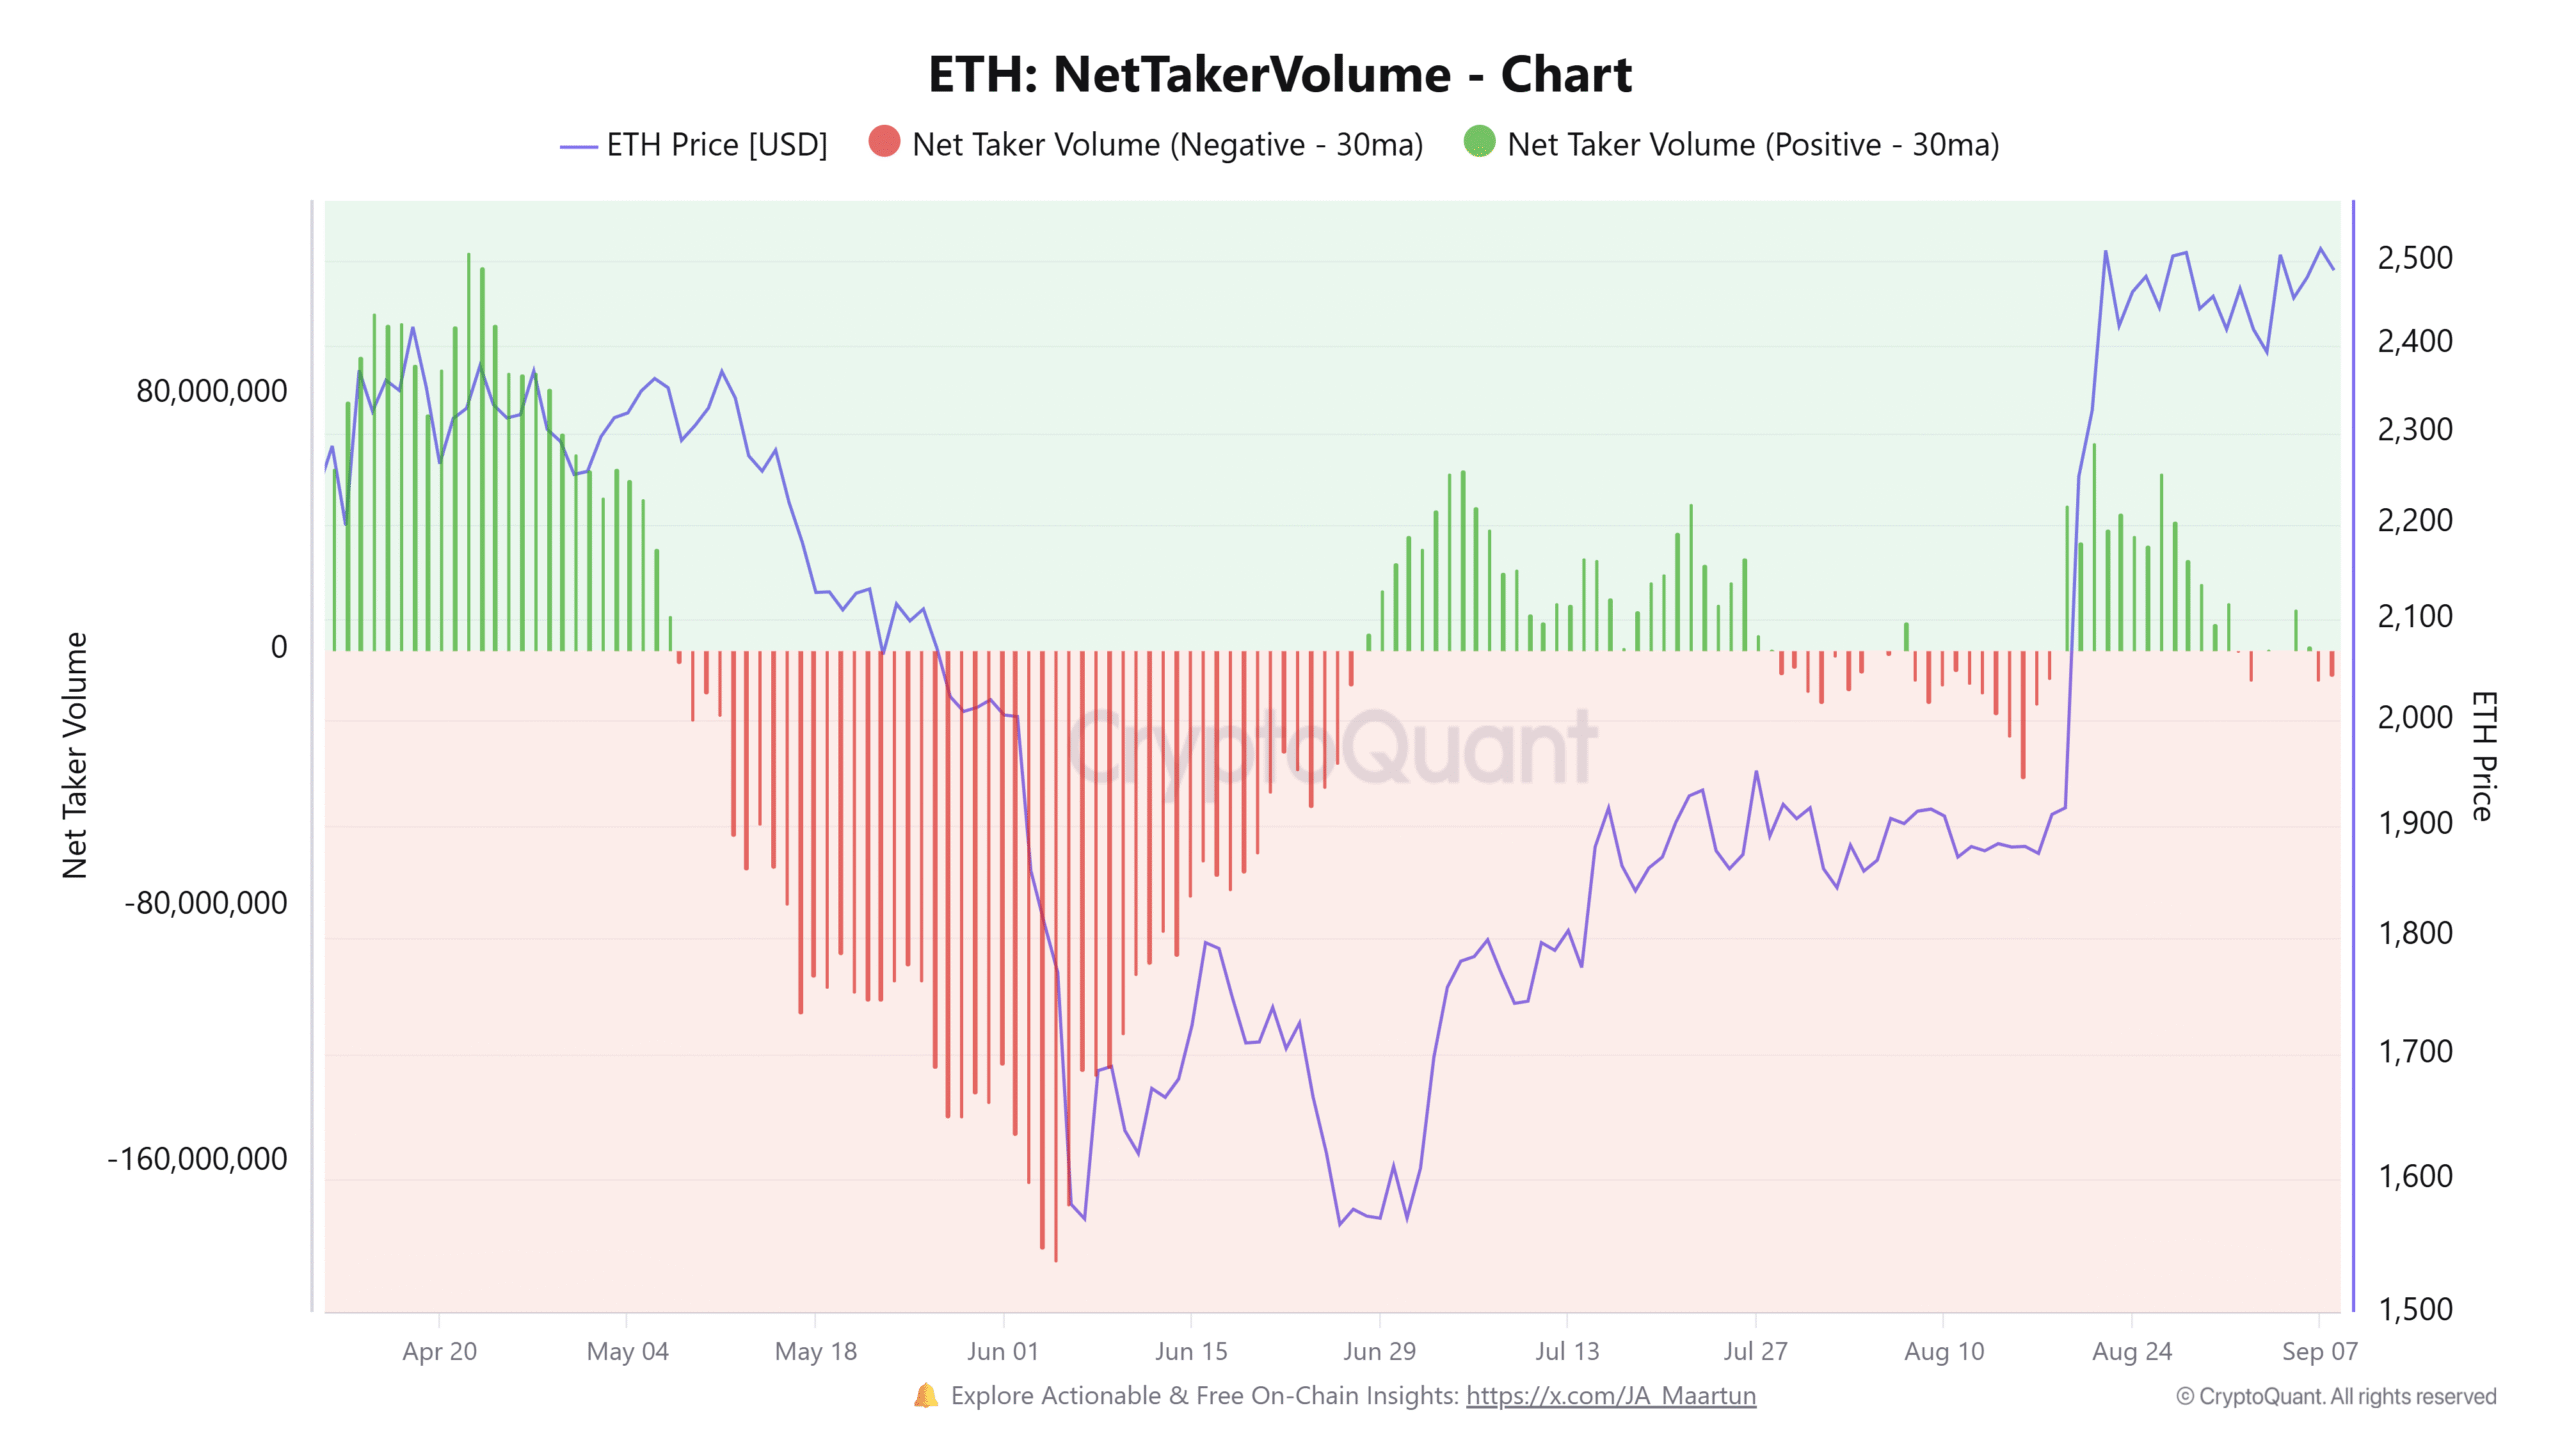
Ethereum futures open interest has declined by approximately 1 million ETH since July, despite the asset’s price advancing 58% during this timeframe. In USD terms, open interest increased 54% to reach $33.7 billion — however, price appreciation exceeding open interest growth indicates leveraged long positions aren’t accumulating with fresh capital.

Net Taker Volume across perpetual futures contracts has registered negative readings in recent sessions, demonstrating balanced forces between bullish and bearish participants in derivatives venues.
Blockchain analytics reveal ETH withdrawals from centralized exchanges have marginally exceeded deposits throughout the previous week. This suggests modest accumulation pressure in spot markets, though the differential remains narrow.
United States-based spot Ethereum ETFs commenced the week recording $24.3 million in net withdrawals on Tuesday, diminishing one channel of institutional capital inflow during the current consolidation phase.
Critical Price Zones Under Observation
Market analyst Jules highlighted the $2,478–$2,485 range as the pivotal near-term reference point, observing that multiple rebounds from this zone demonstrate active buying interest. Jules commented: “Both sides have clean levels. The longer this squeeze lasts, the more the eventual break will matter.” Jules further noted that a decisive close above $2,525–$2,535 could facilitate movement toward $2,580–$2,600.
Market analyst Ted Pillows pinpointed $2,550 as a significant resistance threshold, suggesting a robust weekly close above this level could facilitate advancement toward $3,000.
Cryptocurrency trader Daan Crypto Trades (@DaanCrypto) shared on X that $ETH has been “chopping around in a tiny range for the past 3 weeks” and that this contraction would ultimately produce a substantial directional move. He emphasized $2,350 as vital support for bullish scenarios and $2,550 as the ceiling requiring penetration.
The CoinGlass liquidation heatmap reveals substantial short liquidation concentrations between $2,520 and $2,550, with downside liquidity pooled near $2,430 and a more significant band surrounding $2,355–$2,365.
Ethereum experienced $30.6 million in aggregate liquidations during the preceding 24 hours, with $15.6 million originating from short positions.
Get 3 Free Stock Ebooks
Discover top-performing stocks in AI, Crypto, and Technology with expert analysis.
- Top 10 AI Stocks - Leading AI companies
- Top 10 Crypto Stocks - Blockchain leaders
- Top 10 Tech Stocks - Tech giants



