



Key Takeaways
- ETH hovers around $1,875, repeatedly rejected at the $1,900 resistance level
- The 14-day RSI registers 49.72, indicating neutral momentum with limited directional conviction
- Open interest fell to May lows at 13.3 million ETH before seeing a modest rebound
- Spot Ethereum ETFs in the United States attracted $245 million during their fifth straight week of positive flows
- Critical support established at $1,850; breaking this floor could trigger a decline toward $1,700
Ethereum currently changes hands near $1,875 following repeated rejections whenever bulls attempt to push through the $1,900 threshold. Earlier in the week, ETH momentarily reached $1,920 before retreating into its established trading corridor.
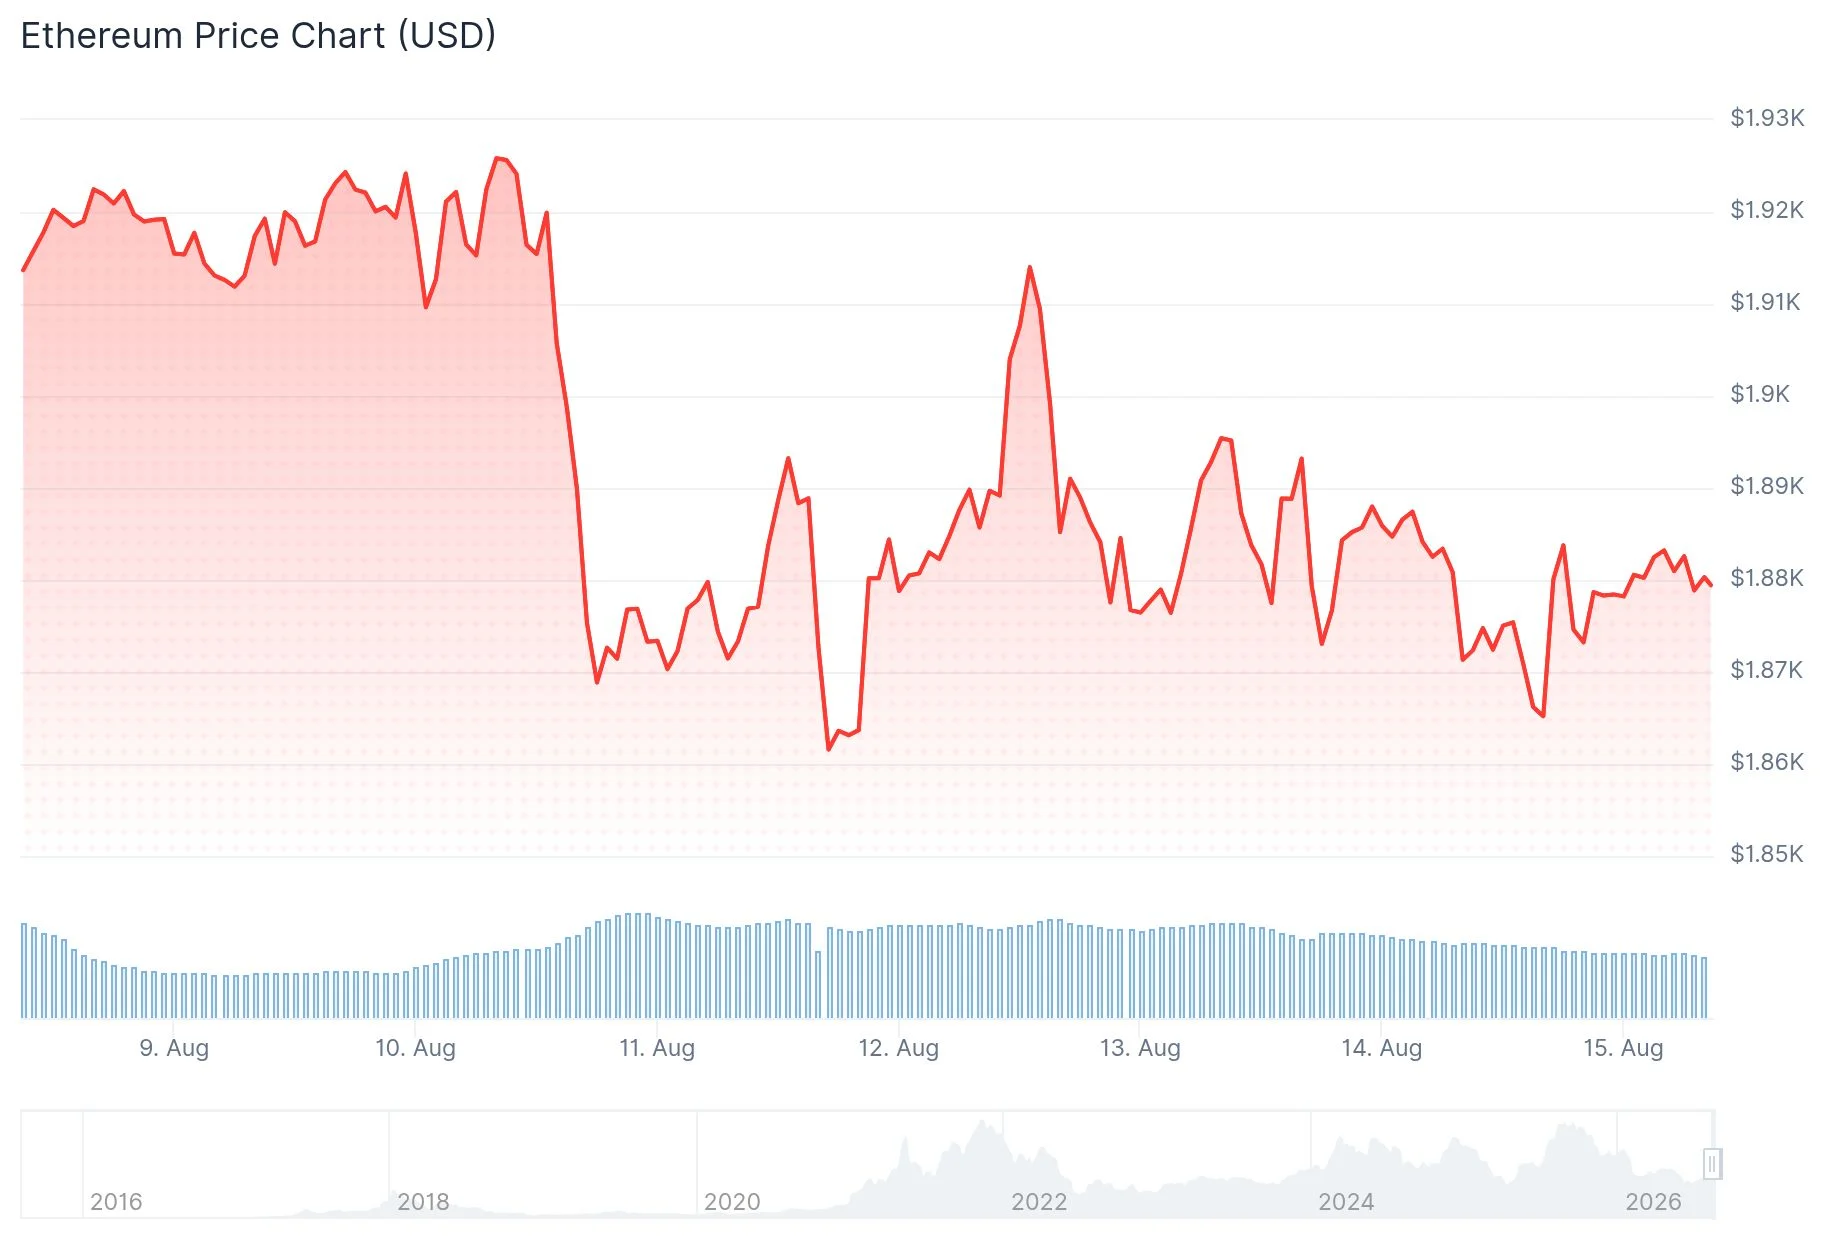
While buyers have successfully protected the $1,850 level, each upward move encounters selling interest around $1,900 to $1,920. Throughout most of August, the asset has remained confined within this tight range.
Technical indicators on the daily timeframe show ETH positioned beneath its 20-day moving average at $1,881 and the 50-day moving average at $1,893. These moving averages have transformed into resistance barriers precisely where recent rallies have stalled.
The Relative Strength Index over a 14-day period reads 49.72, marginally below the neutral threshold of 50. Meanwhile, the Chaikin Money Flow indicator registers -0.01, suggesting an equilibrium between buying and selling forces with sellers holding a marginal advantage.
Institutional Capital Keeps Flowing Despite Sideways Price Movement
Between August 3 and August 7, US-based spot Ethereum exchange-traded funds accumulated $245 million in net positive flows, extending their inflow streak to five consecutive weeks. BlackRock’s ETHA dominated with $203 million in contributions, while Fidelity’s FETH captured $24.2 million. Conversely, Grayscale’s ETHE experienced $4.8 million in outflows during this timeframe.

However, this consistent institutional appetite hasn’t translated into a decisive breakthrough above the $1,900–$1,950 resistance barrier.
Market analyst Daan Crypto Trades highlighted that ETH remains trapped between $1,750 and $2,100 — price levels that have functioned as significant support and resistance zones throughout the previous two years. He identified $2,100 as the critical level warranting close attention, characterizing the recovery above $1,750 as an initial bullish signal while emphasizing that $2,100 represents the genuine challenge ahead.
Cryptocurrency analyst Ted Pillows emphasized $1,850 as an essential support level that ETH must maintain to protect recent price advances. His upside projections include an initial target at $1,955, followed by subsequent levels at $2,050 and $2,190. Should ETH fail to hold $1,850, he warned of a potential descent toward $1,700.
Tight Liquidation Zones Frame Current Price Range
According to CoinGlass’s one-week liquidation heatmap, the most substantial upside liquidity concentrations exist near $1,940–$1,950, accompanied by a notable cluster around $1,925. Below current levels, liquidation density appears near $1,855–$1,860 and $1,835–$1,845.
Ethereum open interest contracted to 13.3 million ETH on Thursday, marking its weakest reading since the beginning of May, before rebounding to 13.9 million on Friday. Funding rates maintained positive territory at approximately 0.0044%, indicating a modest long-side bias despite diminished overall market engagement.
In the last 24 hours, ETH has experienced $26.9 million worth of liquidations, with long positions accounting for $21.1 million of that total.
Get 3 Free Stock Ebooks
Discover top-performing stocks in AI, Crypto, and Technology with expert analysis.
- Top 10 AI Stocks - Leading AI companies
- Top 10 Crypto Stocks - Blockchain leaders
- Top 10 Tech Stocks - Tech giants



