



Key Takeaways
- ETH is currently priced at $1,920.43 with a total market capitalization of $231.76 billion
- Monthly chart displays two TD Sequential Buy signals (Black 9 and S13) indicating potential reversal
- Strong support zone between $1,800–$1,850 has successfully defended against recent pullbacks
- Critical resistance level established between $1,980 and $2,000, followed by potential target at $2,100
- Institutional interest surges as spot Ethereum ETFs recorded $244.94 million in weekly inflows, marking a four-month peak
Ethereum maintains its position around $1,920.43, successfully defending a critical support zone while monthly technical indicators suggest a potential shift in market sentiment.
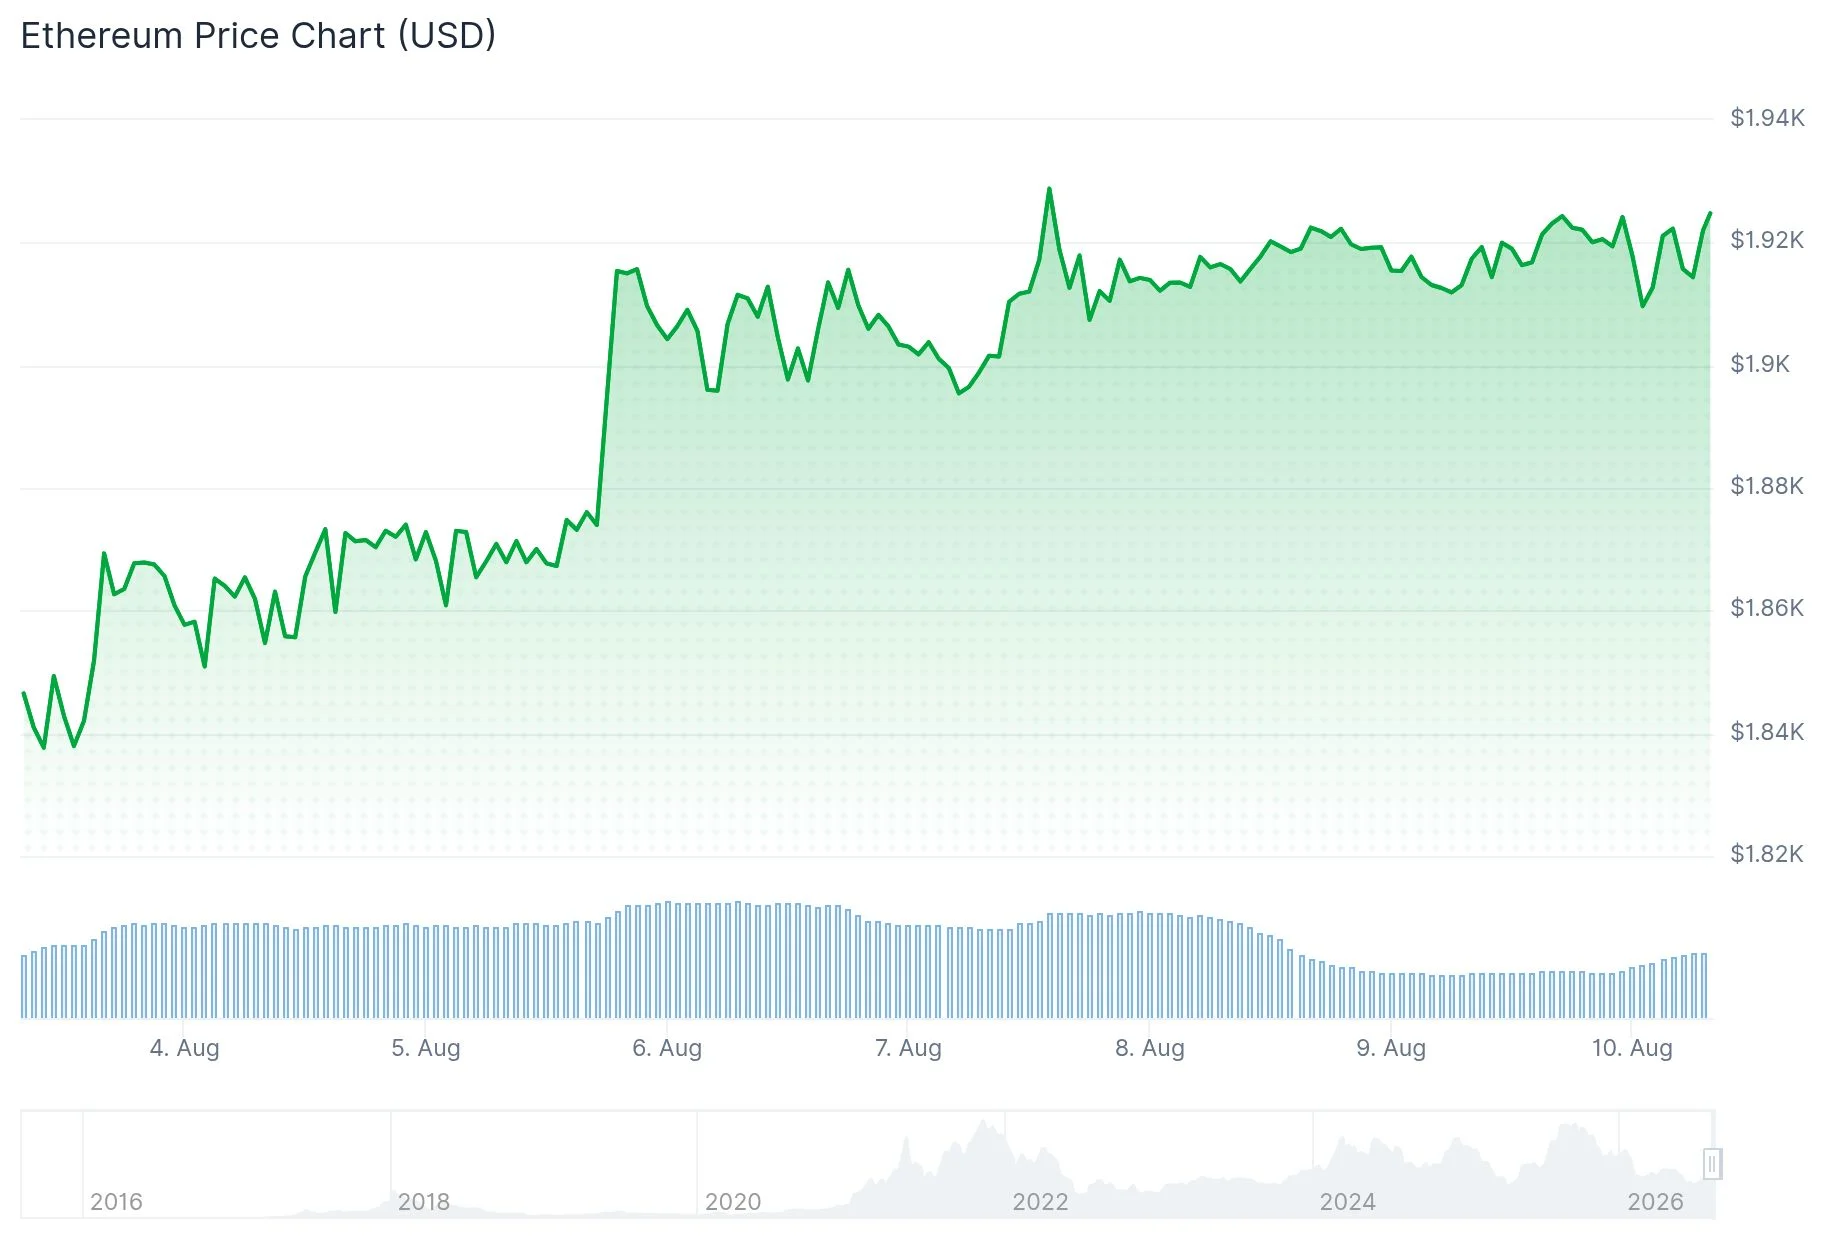
Daily trading activity totals $6.78 billion in volume. The network’s market capitalization hovers near $231.76 billion, representing roughly 10.49% of the entire cryptocurrency market valuation.
ETH’s monthly timeframe chart reveals two significant TD Sequential Buy indicators: a Black 9 formation and an S13 pattern. Historically, these technical formations have emerged at pivotal moments preceding substantial price movements for Ethereum.
Technical analyst Ali Charts highlighted historical precedents for these signals. In September 2022, a Black 9 buy indicator preceded a remarkable 236% price surge. More recently, an A13 buy signal in April 2025 catalyzed a 258% upward movement. While historical patterns don’t ensure identical future outcomes, market participants are monitoring these developments attentively.
Market observer Ted (@TedPillows) emphasized that ETH continues defending the $1,900 threshold. His analysis suggests that maintaining this support level positions Ethereum favorably for advancement beyond $2,000.

The $1,800–$1,850 price range has proven resilient, consistently attracting buyer interest during market corrections. This zone represents the critical downside level market analysts are monitoring.
Breaking Through the $2,000 Ceiling Remains Critical
The $1,980–$2,000 price bracket has proven challenging during the current recovery phase. A decisive move above $2,000 would provide strong confirmation of gathering bullish momentum.
Should ETH successfully breach this resistance zone, attention shifts to $2,100 as the subsequent objective. This price level aligns closely with the 200-day exponential moving average, positioned near $2,124.
Technical indicators show ETH is trading comfortably above its 50-day EMA at $1,864, though encountering resistance near the 100-day EMA around $1,924. The Relative Strength Index registers approximately 56, indicating consistent momentum without entering overbought territory.
The MACD indicator continues showing slight negative values but displays improving trends, indicating diminishing downward pressure.
Institutional Demand Reaches Four-Month Peak
Investment flows into spot Ethereum exchange-traded funds demonstrate strengthening institutional appetite. Last week’s $244.94 million in net inflows represented the strongest weekly performance observed in approximately four months.
Large-scale accumulation continues as two cryptocurrency wallets purchased 80,000 ETH, valued at roughly $152 million, over recent trading sessions.
A breach below the $1,800 support threshold would undermine the current bullish technical framework. The subsequent significant support level lies at $1,385 should deeper correction materialize.
Presently, ETH trades marginally below the 100-day EMA positioned at $1,924, representing the immediate resistance zone requiring attention in the near term.
Get 3 Free Stock Ebooks
Discover top-performing stocks in AI, Crypto, and Technology with expert analysis.
- Top 10 AI Stocks - Leading AI companies
- Top 10 Crypto Stocks - Blockchain leaders
- Top 10 Tech Stocks - Tech giants



