



Key Highlights
- Ethereum trades in a narrow corridor between $1,898 and $1,910
- Major investor accumulates and stakes 10,657 ETH worth approximately $20M
- Spot Ethereum ETFs in the US recorded $30.85M in net inflows this Monday
- Critical resistance level identified at $1,920, with potential rally toward $2,000
- Blockchain data reveals muted exchange activity and tepid US demand
Ethereum continues to hover around the $1,900 mark as market participants await a definitive directional signal. The asset has remained range-bound for several sessions, with neither bulls nor bears gaining decisive control.
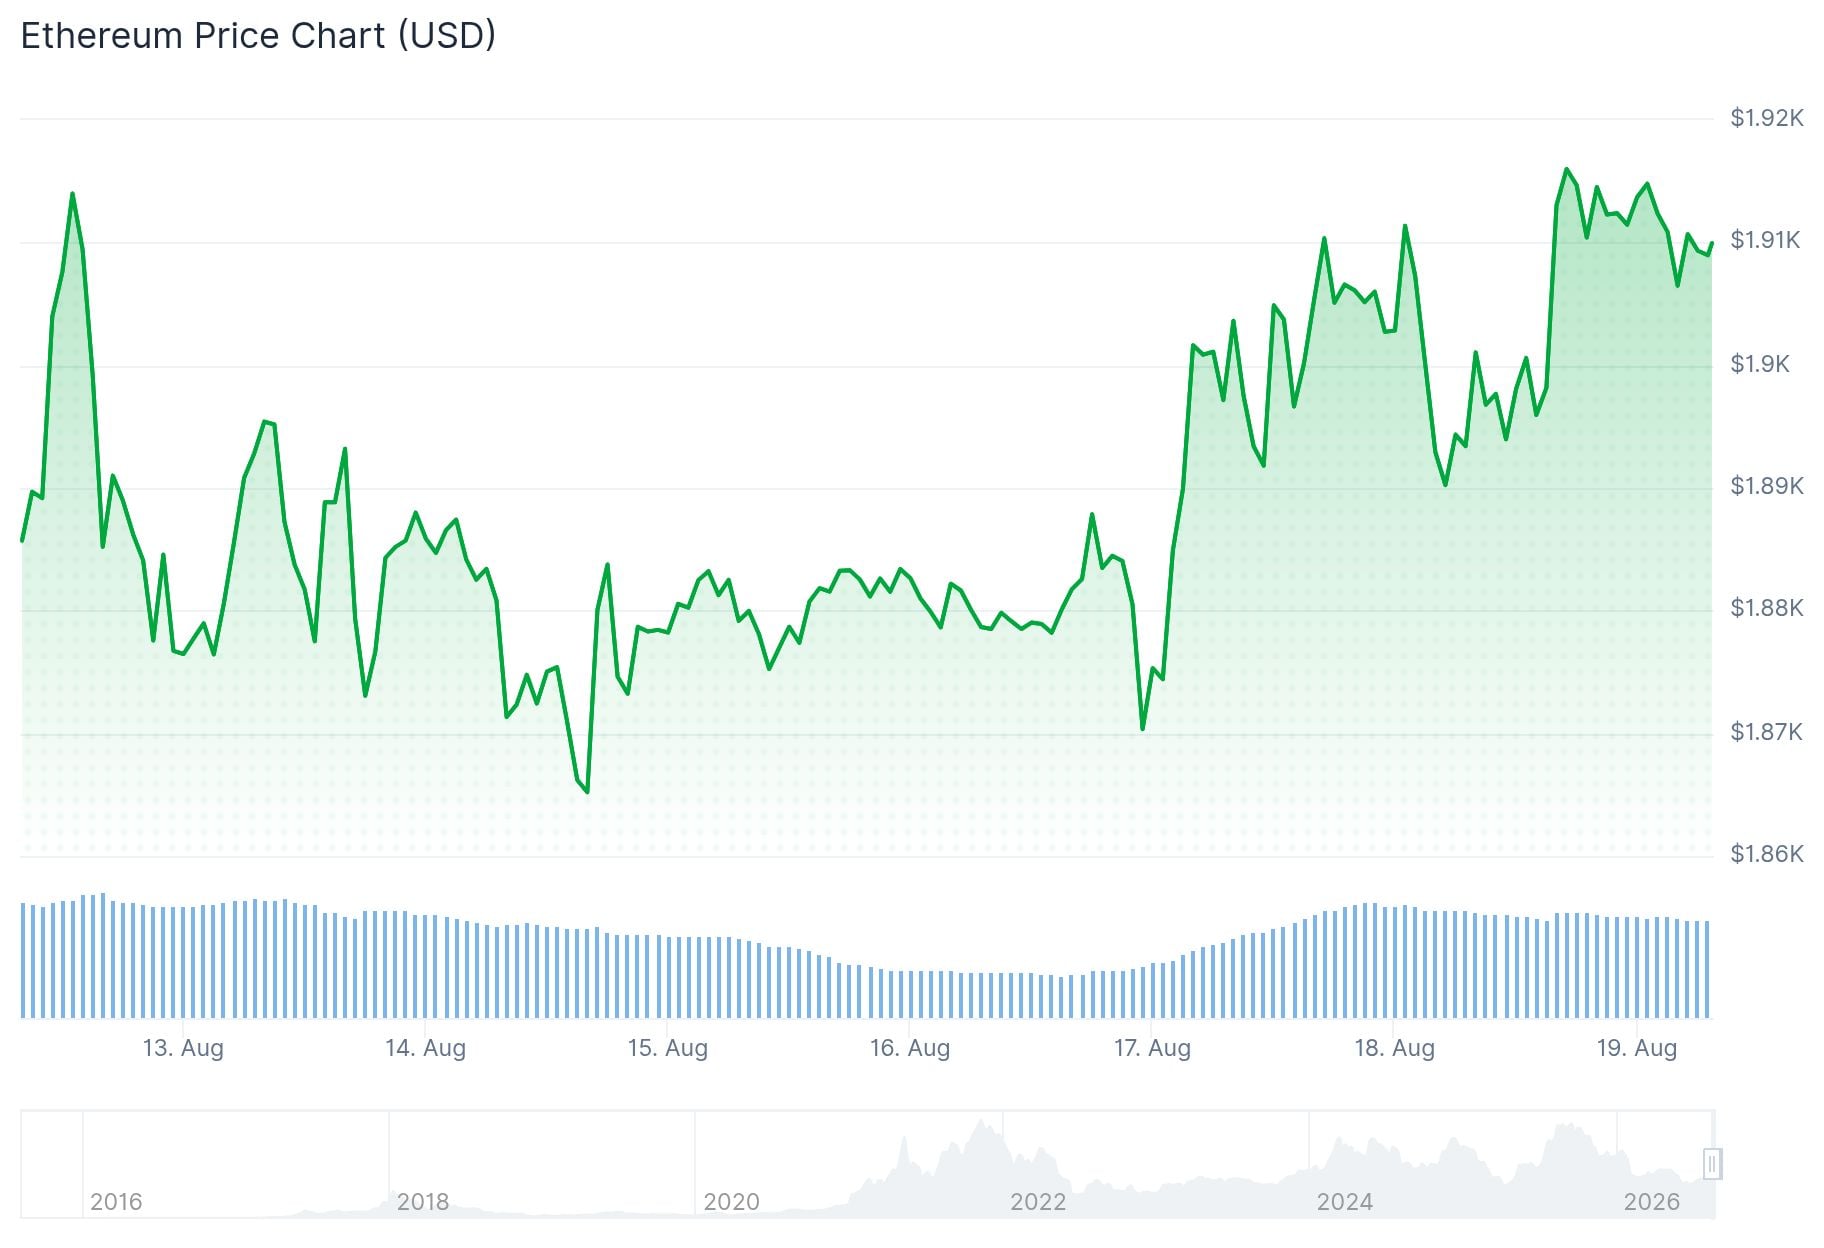
Current market data shows ETH changing hands at $1,898.65, maintaining a market capitalization of $229.15 billion alongside a 24-hour trade volume of $6.83 million.
Significant whale movements have emerged in recent activity. Blockchain intelligence platform Lookonchain identified that wallet address 0x8447 acquired an additional 5,000 ETH valued around $9.53 million, subsequently staking these tokens. This transaction elevates their complete position to 10,657 ETH, representing roughly $20.07 million in total value.
The decision to stake these holdings indicates a commitment to long-term holding rather than immediate profit-taking. This behavior reflects confidence in Ethereum’s future trajectory over quick trading gains.
Market commentator Michaël van de Poppe observed that ETH continues trading within established boundaries and demonstrates weaker momentum compared to Bitcoin’s recent performance. He suggested that an improvement in overall market sentiment could serve as the catalyst for upward price movement.

Digital asset analyst CryptosBatman reinforced this perspective on X, noting that Ethereum has been “compressing more and more each day” and that favorable market conditions could spark a substantial upward break.
Institutional Interest Resurfaces
Monday saw US-based spot Ethereum ETF products attract $30.85 million in net inflows, based on figures from SoSoValue. This marks a reversal from the previous week’s modest $2.26 million in outflows. Prior to that brief decline, these investment vehicles had enjoyed five consecutive weeks of positive net flows.
While institutional capital appears to be returning gradually, the pace remains more measured compared to activity observed earlier this year.
The ETH Coinbase Premium Index has maintained negative readings throughout most of the year. This pattern indicates that demand from US-based retail and institutional investors has yet to experience complete recovery.
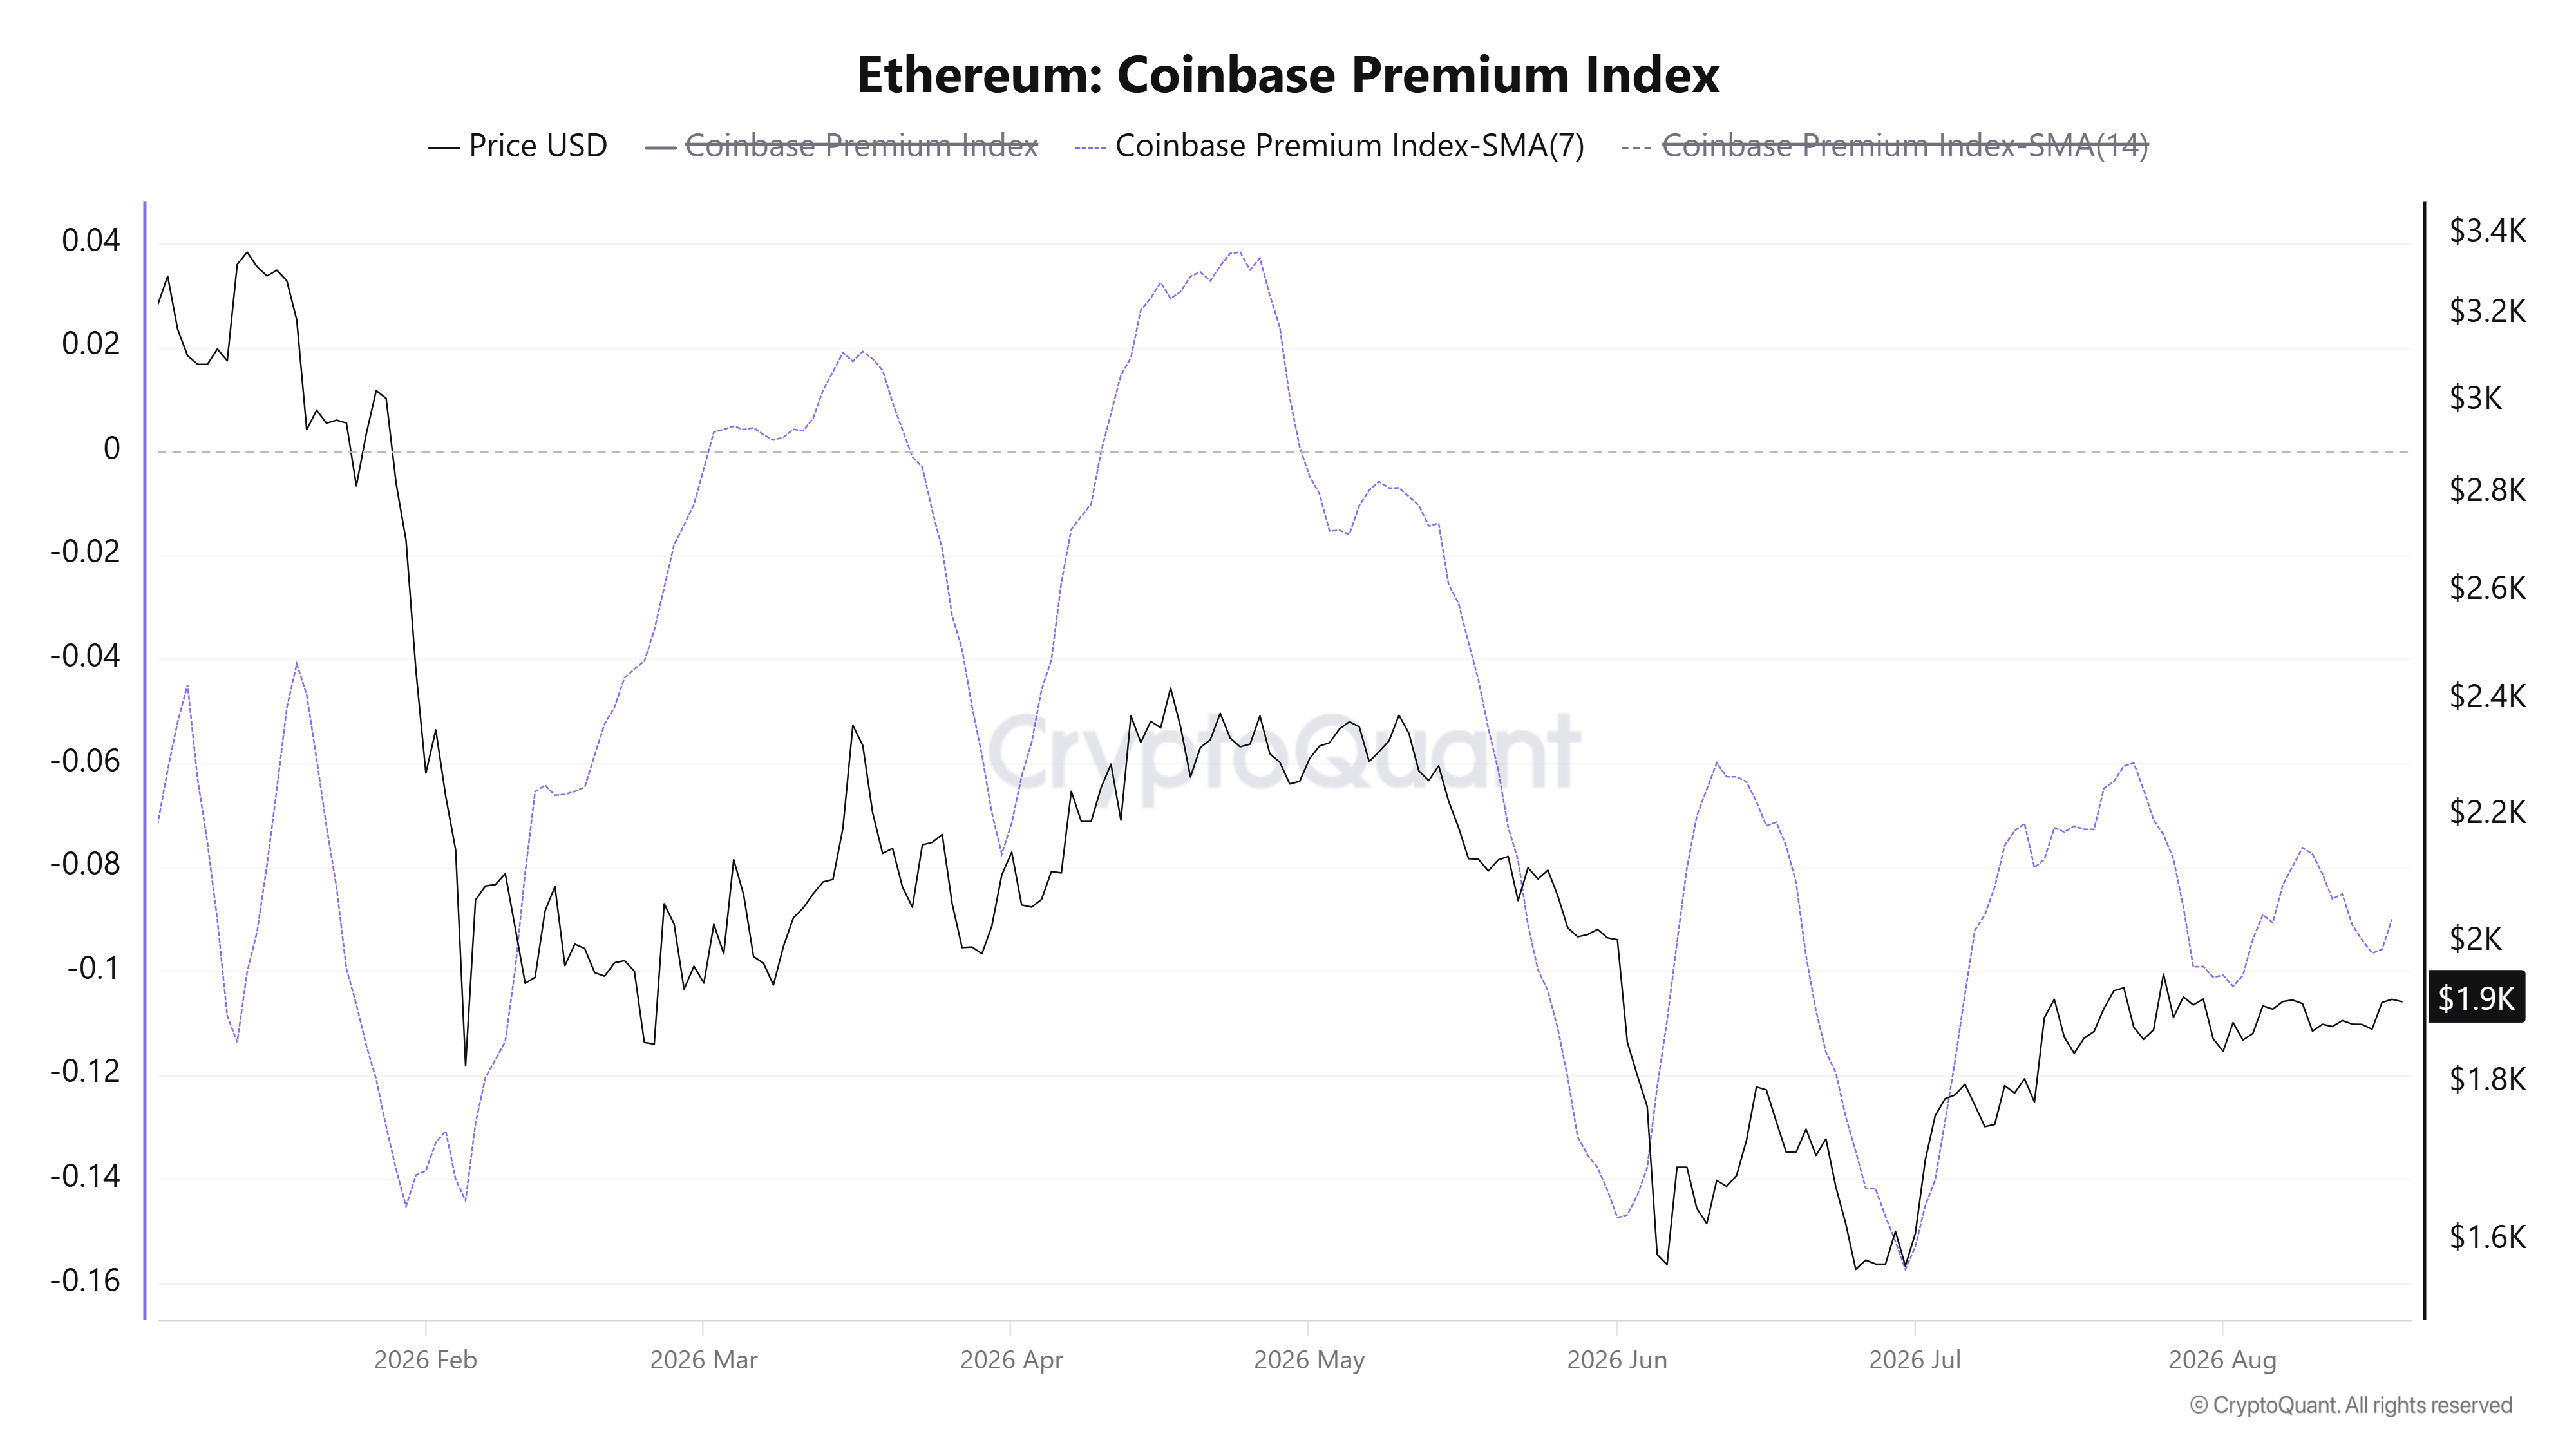
Chart Analysis and Key Price Zones
Daily timeframe analysis shows Ethereum maintaining support above both its 20-day and 50-day exponential moving averages, positioned between $1,870 and $1,889. The 14-period relative strength index currently registers at 57, indicating moderately bullish momentum without entering overbought conditions.
The 100-day exponential moving average represents immediate overhead resistance, with $1,961 serving as another significant barrier. A sustained push above $1,920 could pave the way for a test of the psychological $2,000 level.
According to Coinglass data, liquidations totaling $17.4 million occurred across the past 24 hours, with long position closures accounting for $9.2 million of this figure.
Support zones are established near $1,809 for immediate downside protection, with a more substantial foundation around $1,507 should deeper retracement occur.
Recent blockchain analytics indicate that whale cohorts controlling between 10,000 and 100,000 ETH experienced limited accumulation of approximately 10,000 ETH during the past seven days, while exchange net flows have remained essentially balanced.
Get 3 Free Stock Ebooks
Discover top-performing stocks in AI, Crypto, and Technology with expert analysis.
- Top 10 AI Stocks - Leading AI companies
- Top 10 Crypto Stocks - Blockchain leaders
- Top 10 Tech Stocks - Tech giants



