



Key Highlights
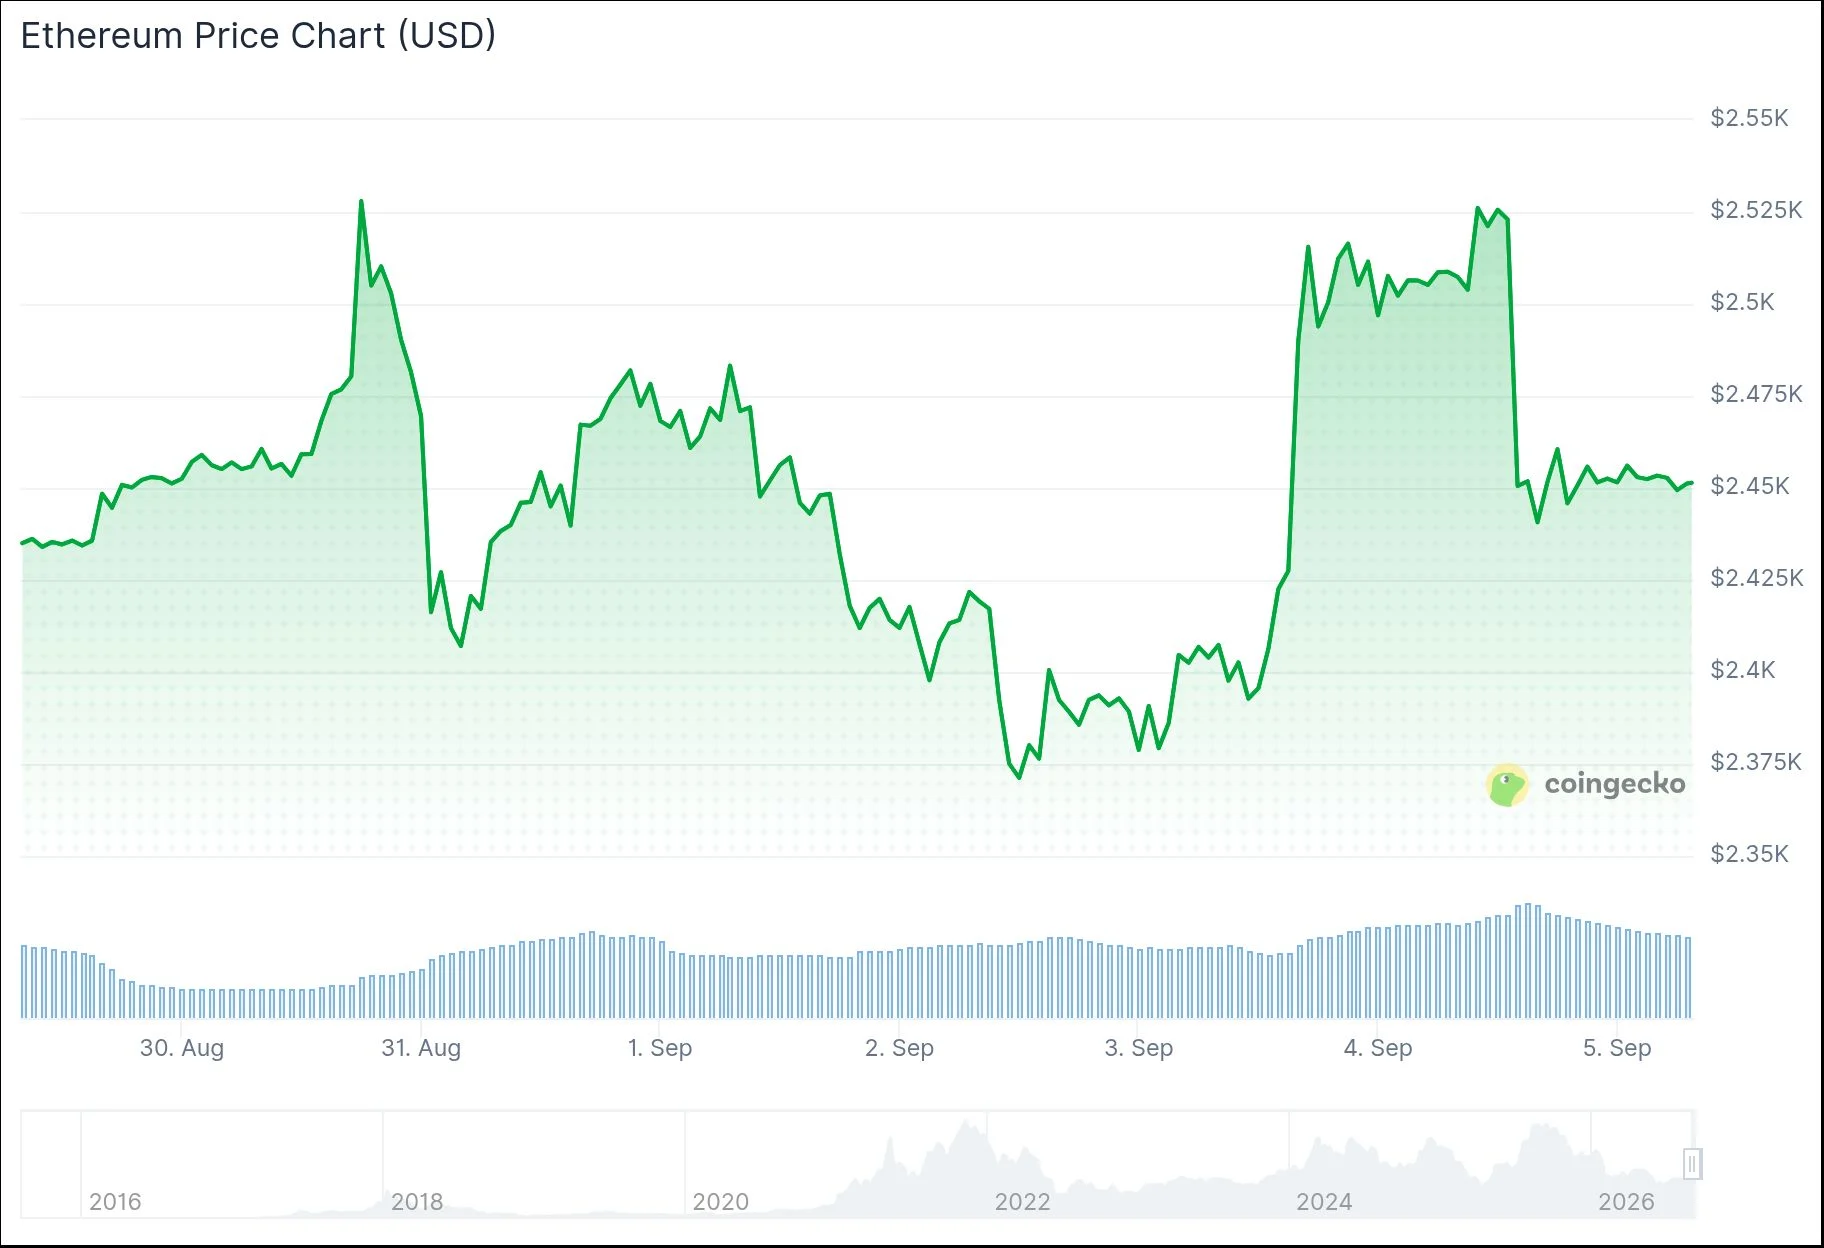
- ETH retraced from $2,546 down to approximately $2,438 amid increased rate-hike expectations impacting risk-on assets
- August US Nonfarm Payrolls registered 162K, significantly exceeding the 56K forecast, driving Fed rate-hike probability to 60%
- Ethereum’s MVRV metric moved back above 1.00 on August 21, marking the first occurrence in 200 days
- A major holder liquidated 167,855 ETH valued at approximately $408 million across a five-day period, creating downward pressure
- Spot ETH ETFs recorded $148M in daily flows on Thursday, bringing August’s total monthly inflows to $1.85 billion
Ethereum is experiencing a pullback toward the $2,400 support zone after climbing to $2,546 earlier in the week. The correction follows unexpectedly strong US employment figures that prompted risk-off sentiment across markets.
August’s US Nonfarm Payrolls expanded by 162K, substantially surpassing the consensus forecast of 56K and showing marked improvement from July’s 21K increase. The unemployment rate remained stable at 4.1%, while labor force participation edged higher to 61.6%.
These robust employment figures elevated the likelihood of a Federal Reserve interest rate increase to the 3.75%–4.00% range to 60%, up from 49% just one day earlier, based on CME FedWatch tool data. Elevated rate expectations typically create headwinds for speculative assets including cryptocurrencies.
At press time, ETH was changing hands at $2,438. Notably, the price continues trading above its 50-day, 100-day, and 200-day Exponential Moving Averages, which converge in the $2,069 to $2,175 range.
The daily Relative Strength Index stands at 61, indicating constructive momentum without reaching overbought conditions. Meanwhile, the MACD indicator has dipped below the zero line, signaling that bullish momentum may be waning.

Major Whale Liquidation Creates Downward Pressure
A significant Ethereum holder liquidated their complete position of 167,855 ETH — valued at roughly $408 million — throughout approximately five days. These funds were transferred to major exchanges including OKX, Binance, and Bybit, as tracked by Lookonchain analytics.
Data shows that approximately 70,739 ETH had been deposited to exchanges at the time of monitoring, while the remaining 97,115 ETH was still held in the wallet. This substantial sell-off is contributing to bearish pressure on ETH’s valuation.
In an unrelated incident, a hacker associated with Coldcard initiated swapping stolen Bitcoin for Ether via THORChain, converting roughly 10% of the stolen assets while 90% remains dormant.
ETF Capital Flows and MVRV Indicate Recovery Phase
On a constructive note, Ethereum spot ETFs attracted $148 million in capital inflows on Thursday. Aggregate inflows have now reached $13 billion, with total net assets under management standing at $16 billion.
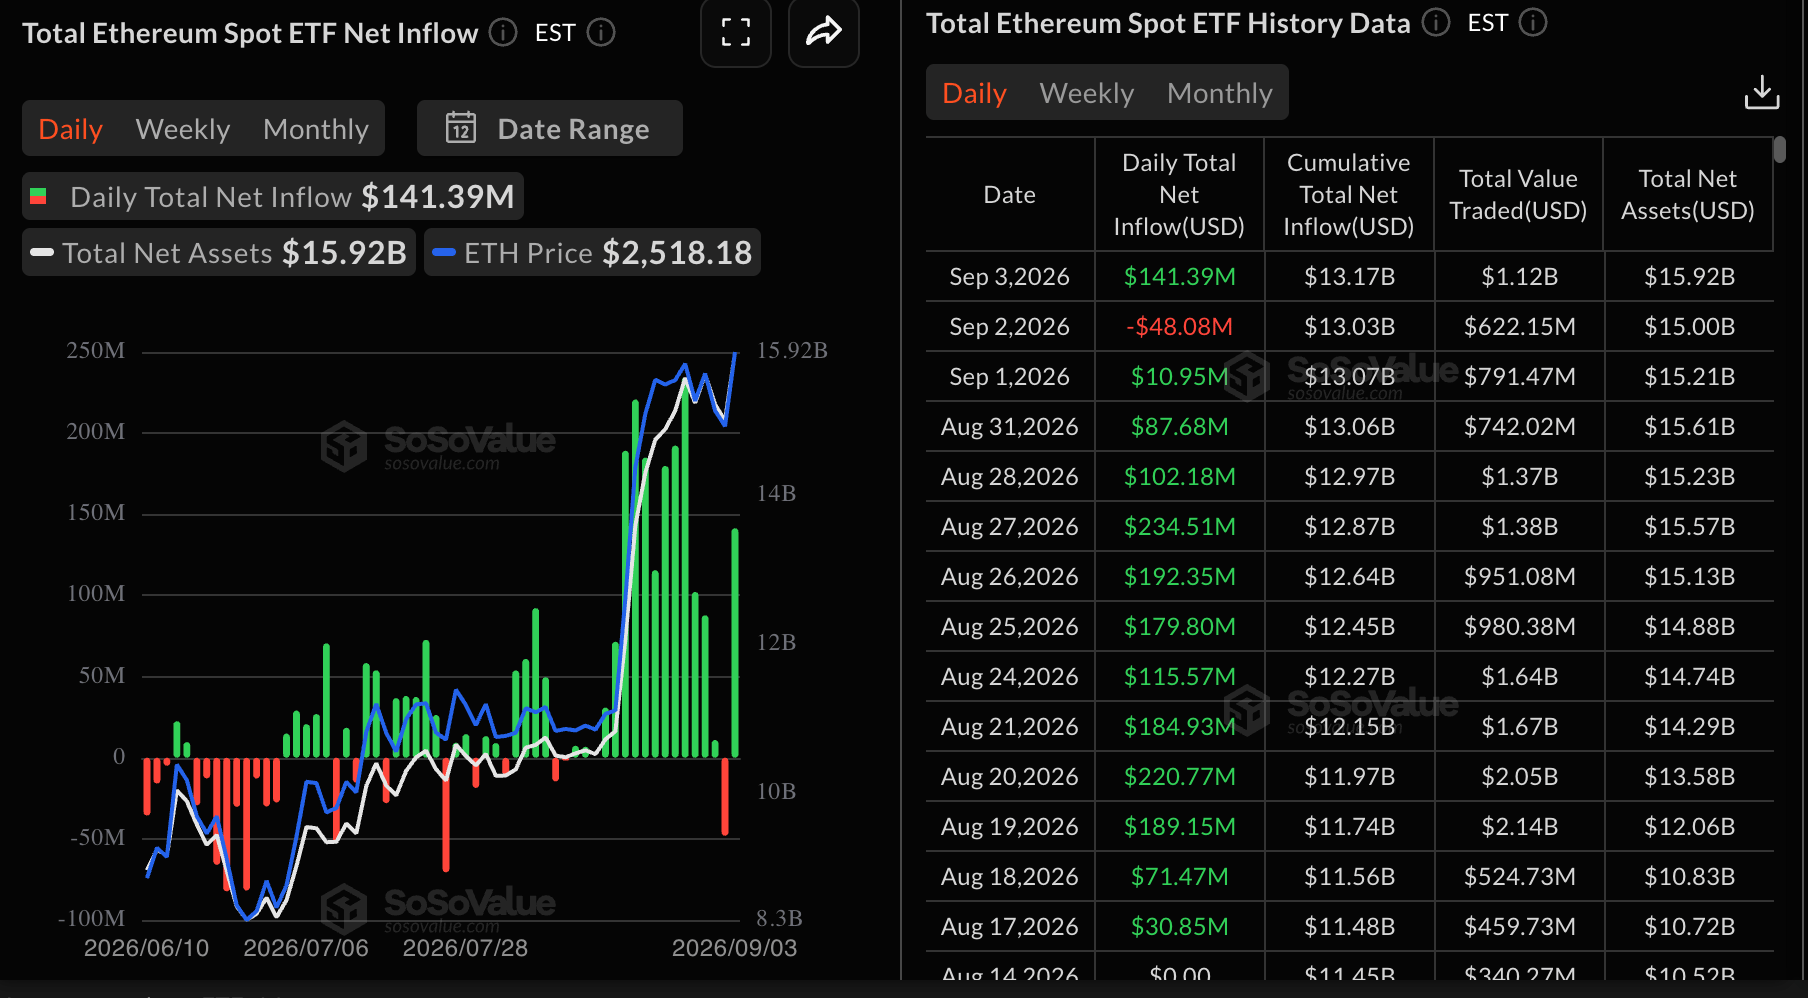
Monthly ETF inflows totaled $365 million in July and jumped to $1.85 billion in August, with September recording $104 million thus far.
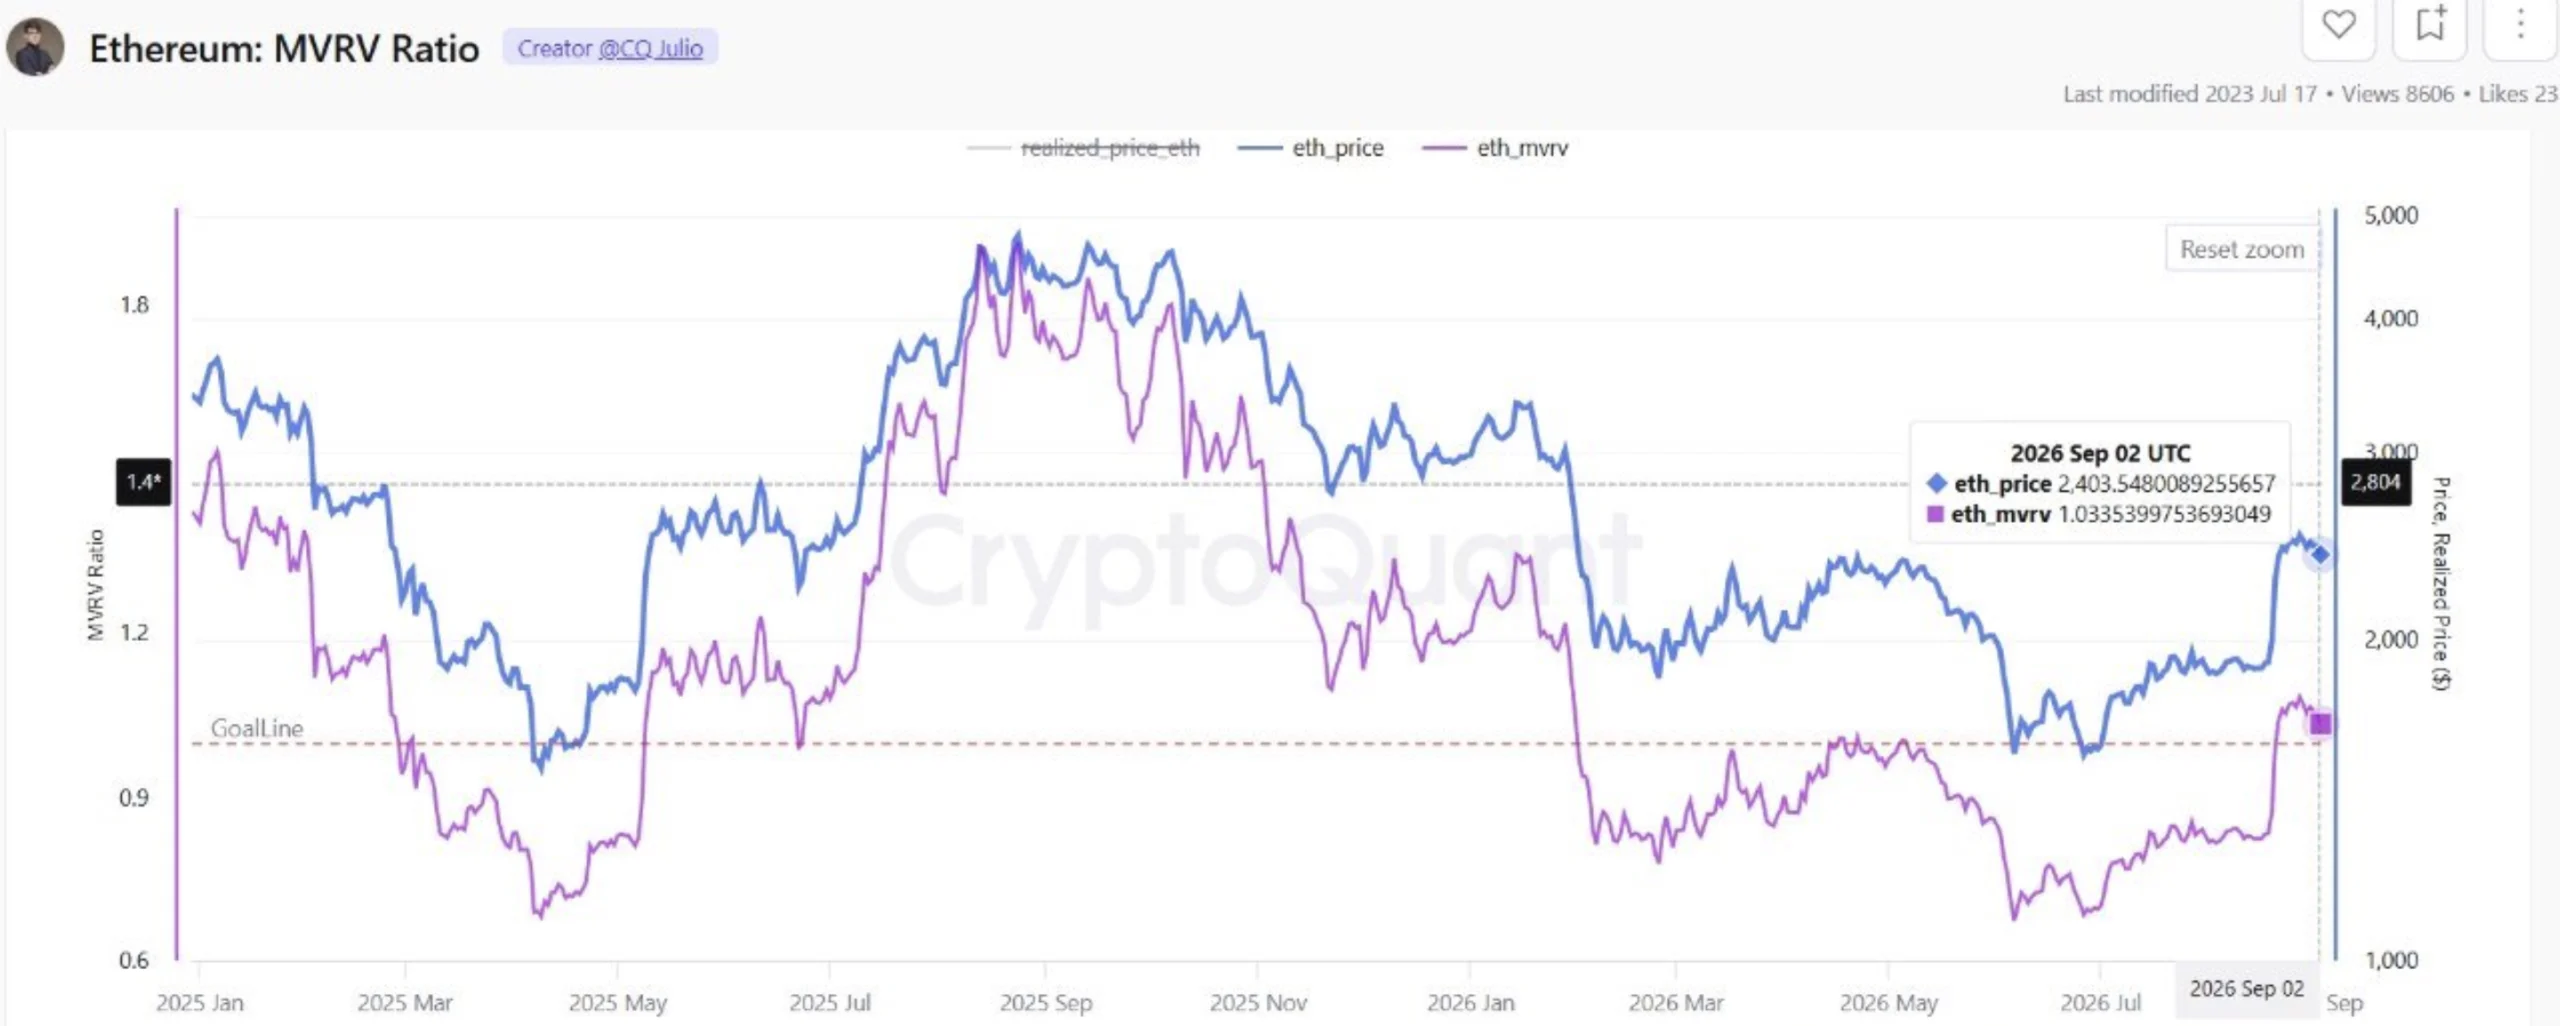
Ethereum’s Market Value to Realized Value (MVRV) ratio climbed back above 1.00 on August 21, representing the first time in 200 consecutive trading days. This metric indicates the average ETH holder has returned to unrealized profitability, with the realized price positioned around $2,300.
Chartered Market Technician Aksel Kibar, recognized as @TechCharts, observed that ETH/USD could be developing a bull flag pattern precisely at resistance, commenting: “$ETHUSD Possible bull flag right at the resistance. I like this tight consolidation. Wait for breakout confirmation.” Kibar’s analysis indicates the current consolidation phase may precede an upward breakout, though he emphasizes awaiting confirmation before validating the move.
September ETH ETF inflows currently total $104.26 million, as bulls continue attempting to establish $2,500 as a sustainable support level.
Get 3 Free Stock Ebooks
Discover top-performing stocks in AI, Crypto, and Technology with expert analysis.
- Top 10 AI Stocks - Leading AI companies
- Top 10 Crypto Stocks - Blockchain leaders
- Top 10 Tech Stocks - Tech giants



