



Key Takeaways
- DOGE maintains its position around $0.0985 following a sustained recovery from September’s bottom.
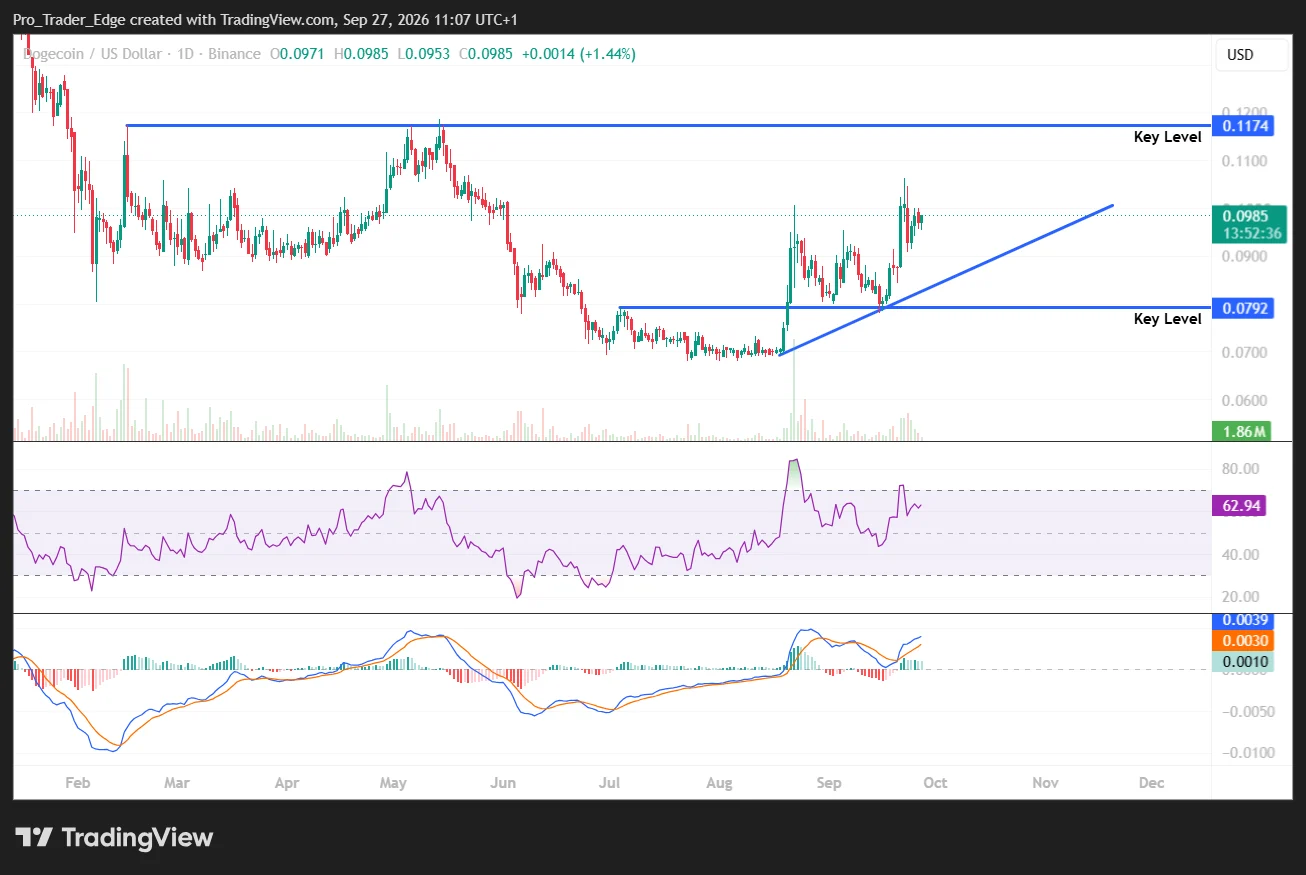
- An ascending support line established in August continues to support the bullish technical formation.
- Critical support zone identified at $0.0792, while key resistance barrier stands at $0.1174.
- The Relative Strength Index registers 62.94, indicating healthy momentum without reaching excessive levels.
- The MACD indicator remains in positive territory with bullish configuration intact.
The popular meme cryptocurrency is currently changing hands around $0.0985 following its latest upward movement. The digital asset continues to respect its ascending daily support trend line.
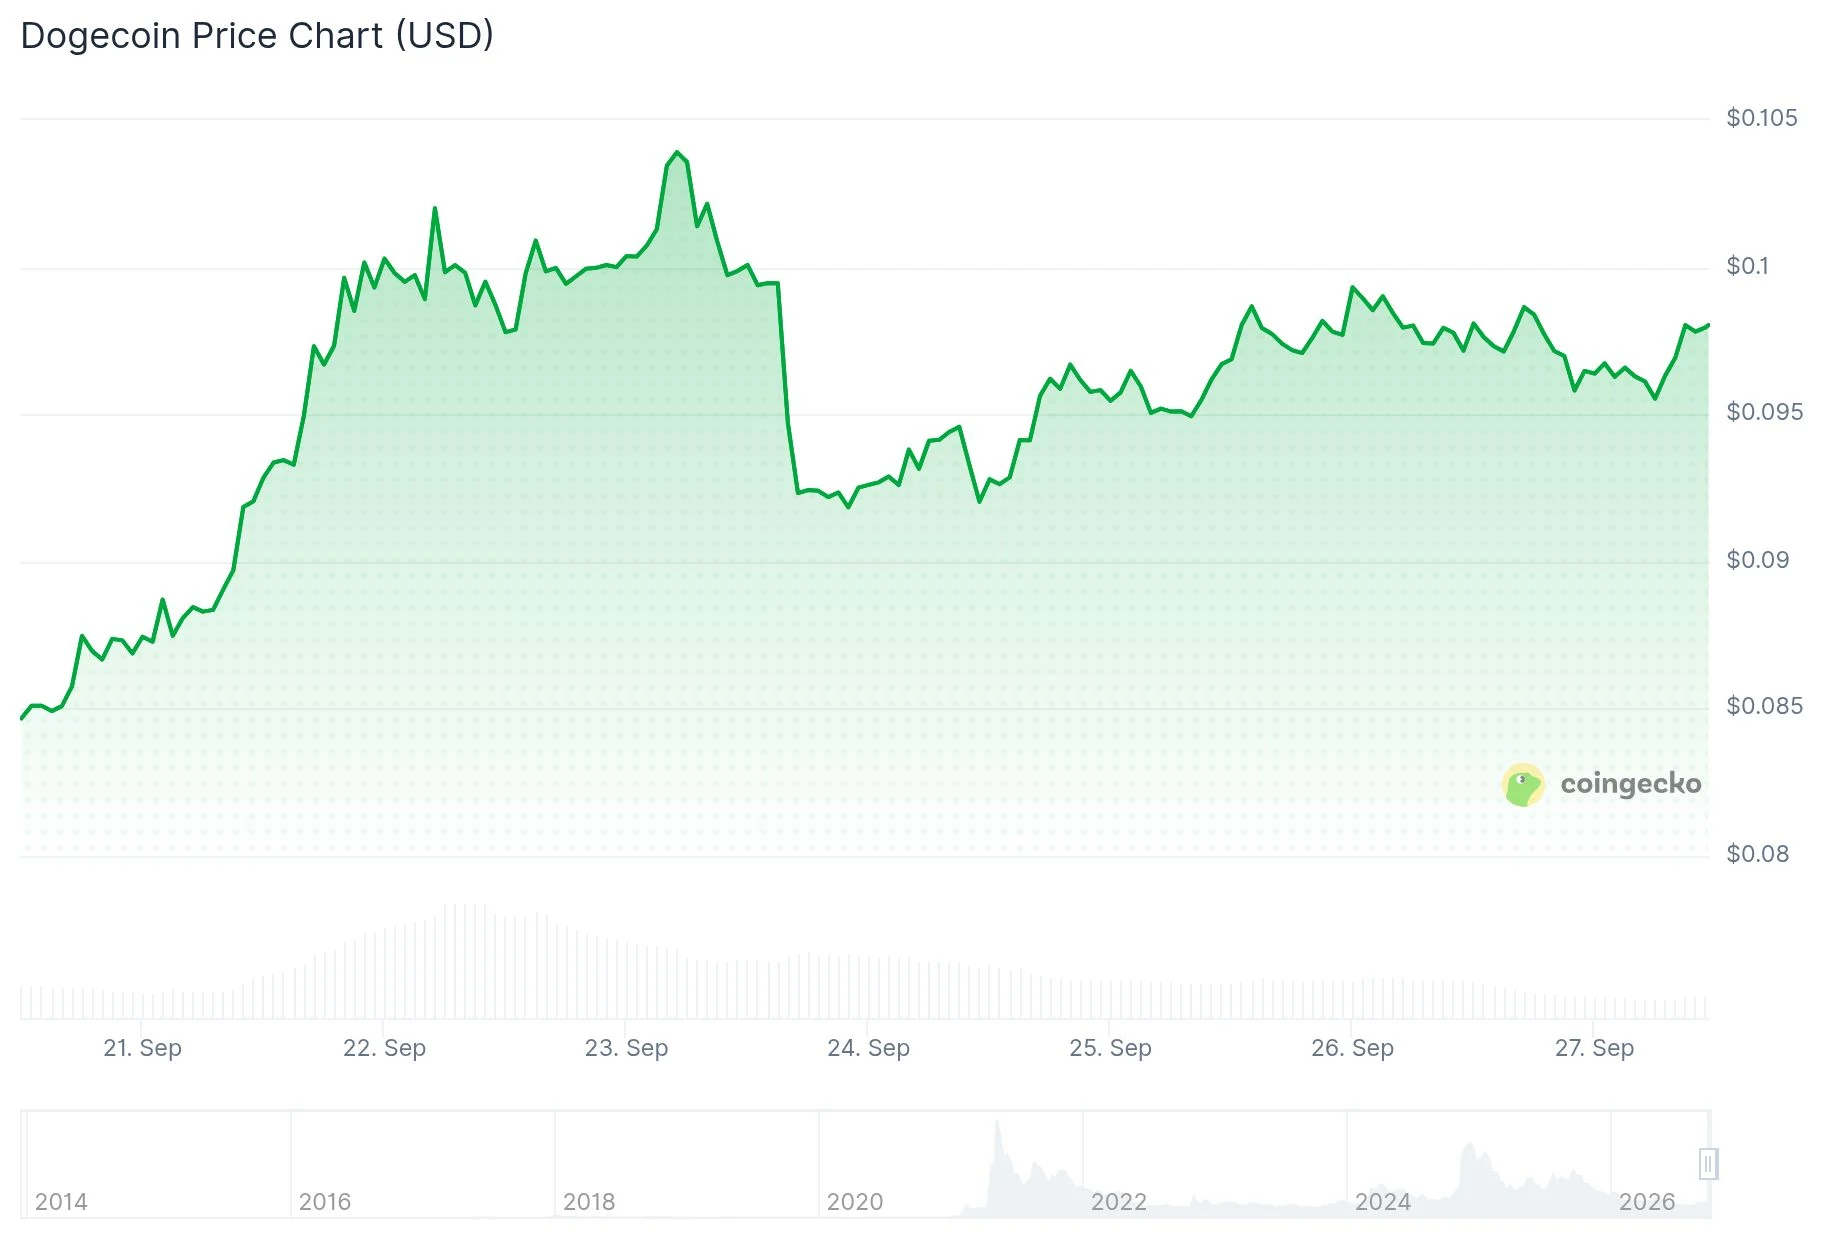
Today’s trading session began with DOGE opening near $0.0971, subsequently reaching an intraday peak close to $0.0985. The token registered approximately 1.4% gains during this period.
The macro outlook has shown notable improvement since late summer. Following a bottom formation around $0.069 in August, DOGE established a constructive pattern characterized by consecutive higher lows and higher highs.
This upward trajectory formed an ascending support trend line that has successfully defended price action throughout September. Currently, this technical support line sits in the lower $0.08 region beneath current market levels.
Critical Price Zones Under Focus
Technical analysis reveals a significant horizontal support area positioned around $0.0792. This price level has functioned as a crucial decision point throughout the recent upward move.

Looking upward, the primary resistance zone is located at $0.1174. This barrier previously rejected price during the May surge and continues to represent the most significant obstacle on the daily timeframe.
While DOGE remains considerably below this target, the ongoing recovery phase has gradually brought it back into reasonable striking distance.
Prior to challenging the $0.1174 threshold, market participants must first establish control above the $0.10 psychological level. Dogecoin has tested this round-number barrier multiple times throughout the current month.
Successfully clearing $0.10 would reinforce the near-term bullish framework and establish a more direct trajectory toward the May resistance area.
Should downside pressure emerge, the ascending trend line provides initial protection. However, the $0.0792 zone represents the more critical support foundation.
A decisive breakdown beneath $0.0792 would compromise the existing higher-low sequence and redirect attention toward the August base formation.
Technical Indicators And Large Holder Activity
The Relative Strength Index for Dogecoin currently stands at 62.94. This reading positions above the neutral 50 midpoint while remaining comfortably beneath the 70 overbought boundary.
This configuration suggests solid buying pressure without excessive speculation. The MACD histogram maintains bullish alignment, with the primary line registering near 0.0039 compared to the signal line around 0.0030.
The histogram value of approximately 0.0010 demonstrates that near-term momentum has regenerated following the recent consolidation. Trading volume has expanded during multiple September sessions, particularly during the breakout phase from $0.0792.
Market analyst Ali Charts highlighted significant whale accumulation during this timeframe. According to his analysis, Dogecoin encountered resistance around $0.098, an area where approximately 28 billion DOGE previously traded hands, yet large holders have accumulated more than 1.14 billion $DOGE over the past 96 hours, representing nearly $112 million in value, suggesting preparation for an upside breakout.
Current technical conditions show DOGE maintaining position above its ascending support with momentum gauges continuing to flash bullish signals. The market now attempts to generate sufficient buying pressure to overcome the $0.10 psychological barrier and subsequently test the $0.1174 resistance zone.
Get 3 Free Stock Ebooks
Discover top-performing stocks in AI, Crypto, and Technology with expert analysis.
- Top 10 AI Stocks - Leading AI companies
- Top 10 Crypto Stocks - Blockchain leaders
- Top 10 Tech Stocks - Tech giants



