



Quick Overview
- Dogecoin retreated to $0.086 following a rejection at the critical $0.100 resistance zone, representing a 14% decline from its August high
- Open interest in perpetual futures contracts decreased to 15.7 billion DOGE, indicating reduced speculative momentum
- Despite recent pullback, DOGE maintains a 25% gain for August, poised for its strongest monthly performance in 2026
- On-chain accumulation metrics reached maximum levels at 100, revealing sustained buying pressure beneath price declines
- Critical price zones: $0.081 acts as downside protection while $0.09 represents the breakout threshold; successful breach could propel prices toward $0.115
Following an impressive August surge that propelled Dogecoin to a quarterly peak of $0.100, the popular meme cryptocurrency is experiencing a retracement phase. Current market activity shows DOGE changing hands near the $0.084–$0.086 range, reflecting approximately a 14% correction from its recent zenith.
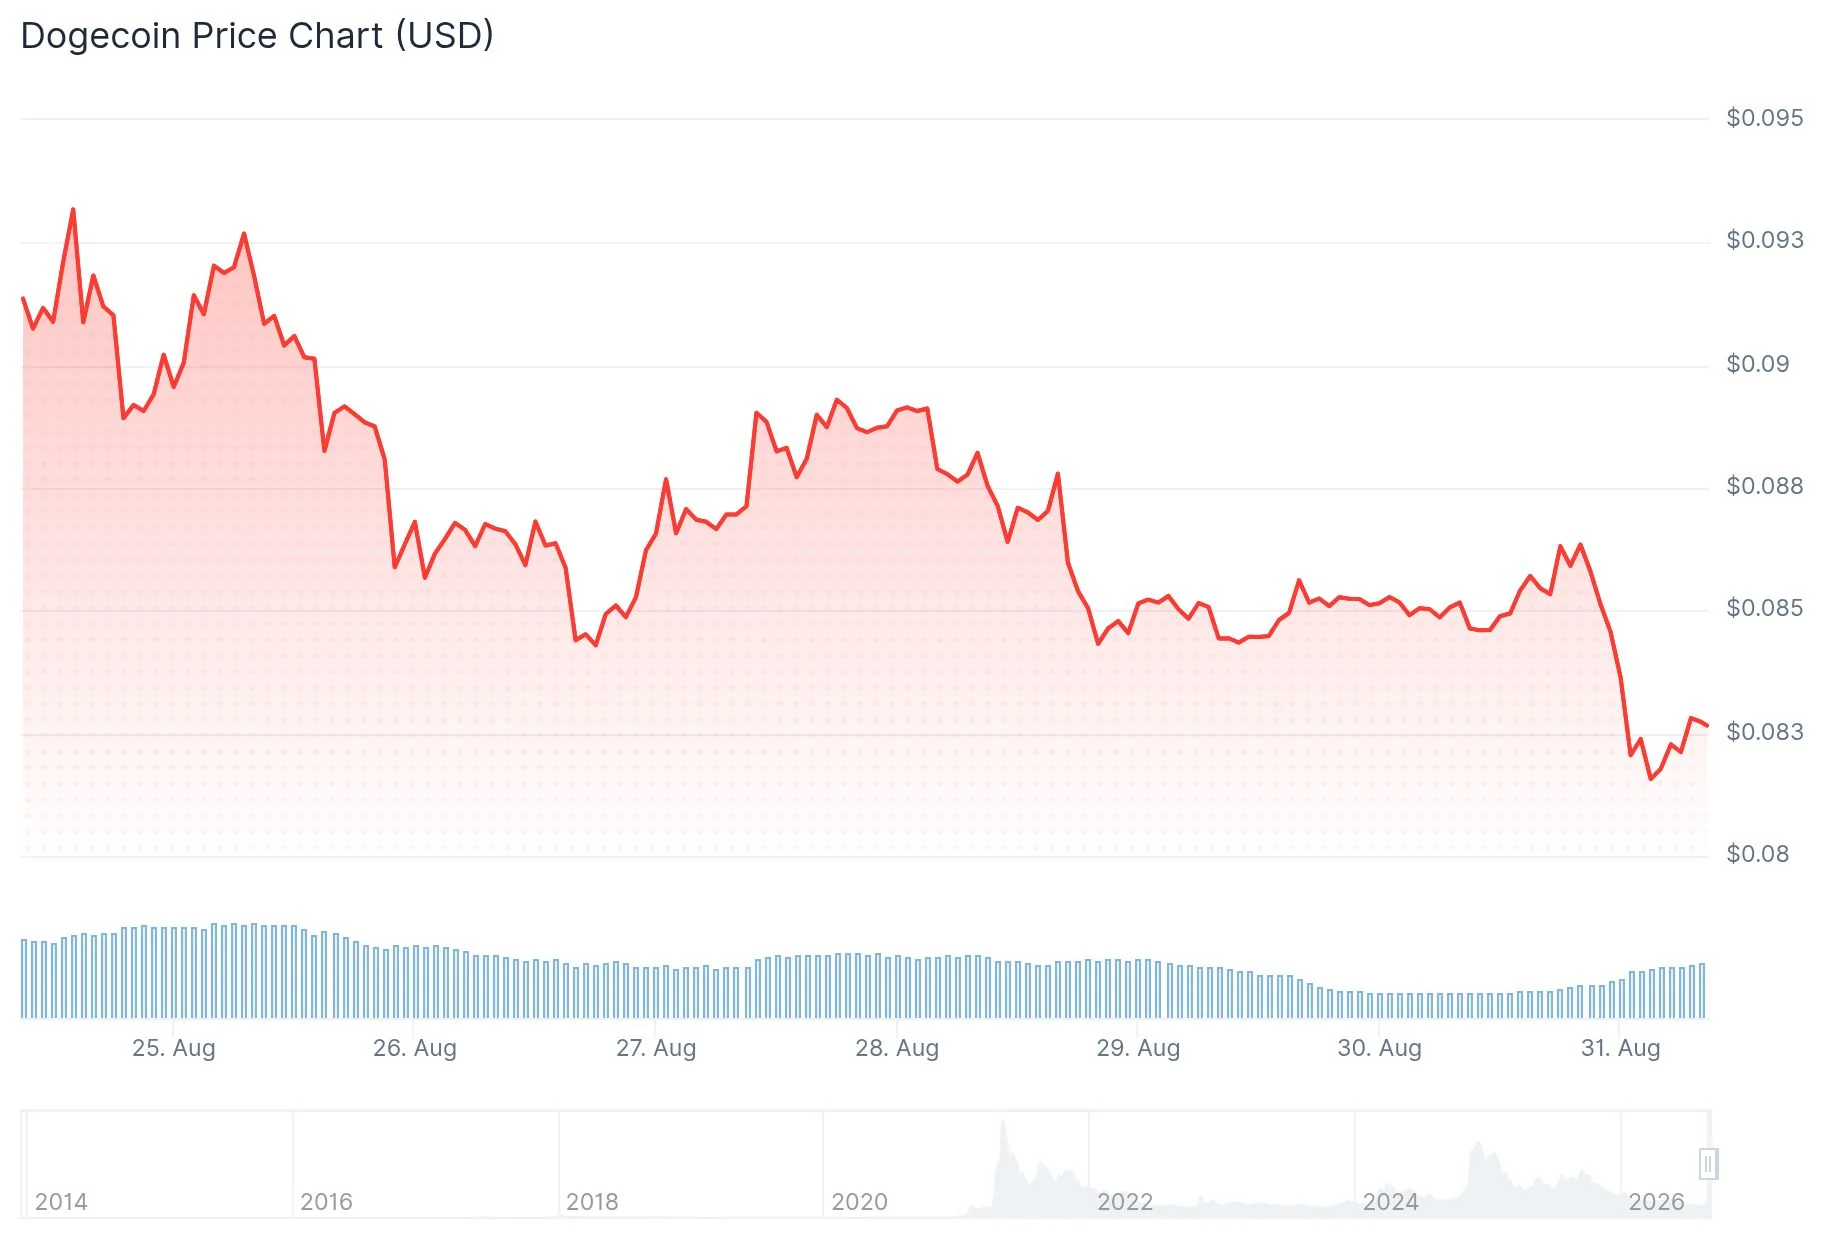
The recent decline hasn’t erased DOGE’s monthly gains, which remain firmly in positive territory at 25% for August. Should this hold through month’s end, it would represent the cryptocurrency’s strongest monthly showing in 2026 and successfully terminate a three-month downtrend.
Market participation has experienced a notable contraction, with daily trading volume plummeting from $5.2 billion recorded on August 23 to a modest $1.5 billion currently. Simultaneously, perpetual futures open interest has contracted from 17.3 billion DOGE to 15.7 billion DOGE during this timeframe, signaling diminished speculative engagement.
Conversely, blockchain metrics paint an encouraging picture. According to on-chain specialist CW, DOGE’s accumulation indicator has climbed to a perfect 100 reading. This metric suggests consistent acquisition activity throughout the week rather than isolated buying spikes.
From a moving average perspective, DOGE maintains its position above both the 50-day EMA ($0.078) and 100-day EMA ($0.082). The challenge lies ahead at the 200-day EMA, positioned around $0.095, which continues to cap upside momentum.

Technical Formations Emerging
Multiple constructive chart patterns are materializing across different timeframes. Technical analyst Crypto Tony has highlighted a developing inverse head-and-shoulders structure, featuring a neckline breakout scenario that projects a measured move to $0.098. This formation awaits final validation.
Meanwhile, chart expert Ali Charts has identified a bullish flag consolidation pattern following the recent upward impulse. The decisive threshold stands at $0.09 — securing an hourly candle close above this mark could unlock sequential targets at $0.096, $0.105, and ultimately $0.115. Critical downside protection remains anchored at $0.081.
Contributing to the optimistic outlook, analyst MikybullCrypto shared on X that $DOGE has potential to exceed $1 during the next bull cycle, emphasizing a crucial price level that warrants attention — further reinforcing the constructive narrative surrounding the token.
DOGE Relative to Bitcoin
Examining the DOGE/BTC trading pair reveals interesting dynamics. The monthly Relative Strength Index has slipped beneath the 40 threshold. Analyst Crypto Surf observes this condition has materialized only twice previously throughout the pair’s trading history. While statistically uncommon, this indicator reading requires additional confirmation before signaling a definitive trend reversal.
The RSI measurement on the dollar-denominated chart registers approximately 63, remaining comfortably below overbought conditions, while the MACD histogram continues displaying positive momentum.
DOGE presently oscillates within a defined range bounded by $0.081 support below and $0.09 resistance above, with spot pricing hovering near $0.08447 as of August 31.
Get 3 Free Stock Ebooks
Discover top-performing stocks in AI, Crypto, and Technology with expert analysis.
- Top 10 AI Stocks - Leading AI companies
- Top 10 Crypto Stocks - Blockchain leaders
- Top 10 Tech Stocks - Tech giants



