


Key Takeaways
- DOGE currently sits at $0.0734, positioned beneath all significant EMAs, signaling continued bearish pressure
- Open Interest in futures contracts increased to 15.45 billion DOGE from the previous day’s 14.64 billion
- Daily trading volume jumped beyond $1 billion, representing more than a 100% increase from the prior day’s $438 million
- Technical analyst Ali Charts identifies consecutive weekly TD Sequential buy signals appearing on the chart
- Trader Tardigrade observes DOGE’s monthly Stoch RSI reaching oversold territory, replicating conditions from 2022
Dogecoin currently changes hands near $0.0734 this Tuesday while the wider cryptocurrency market experiences a recovery phase. The popular meme coin demonstrates signs of finding its footing, although technical indicators still suggest bearish conditions prevail.
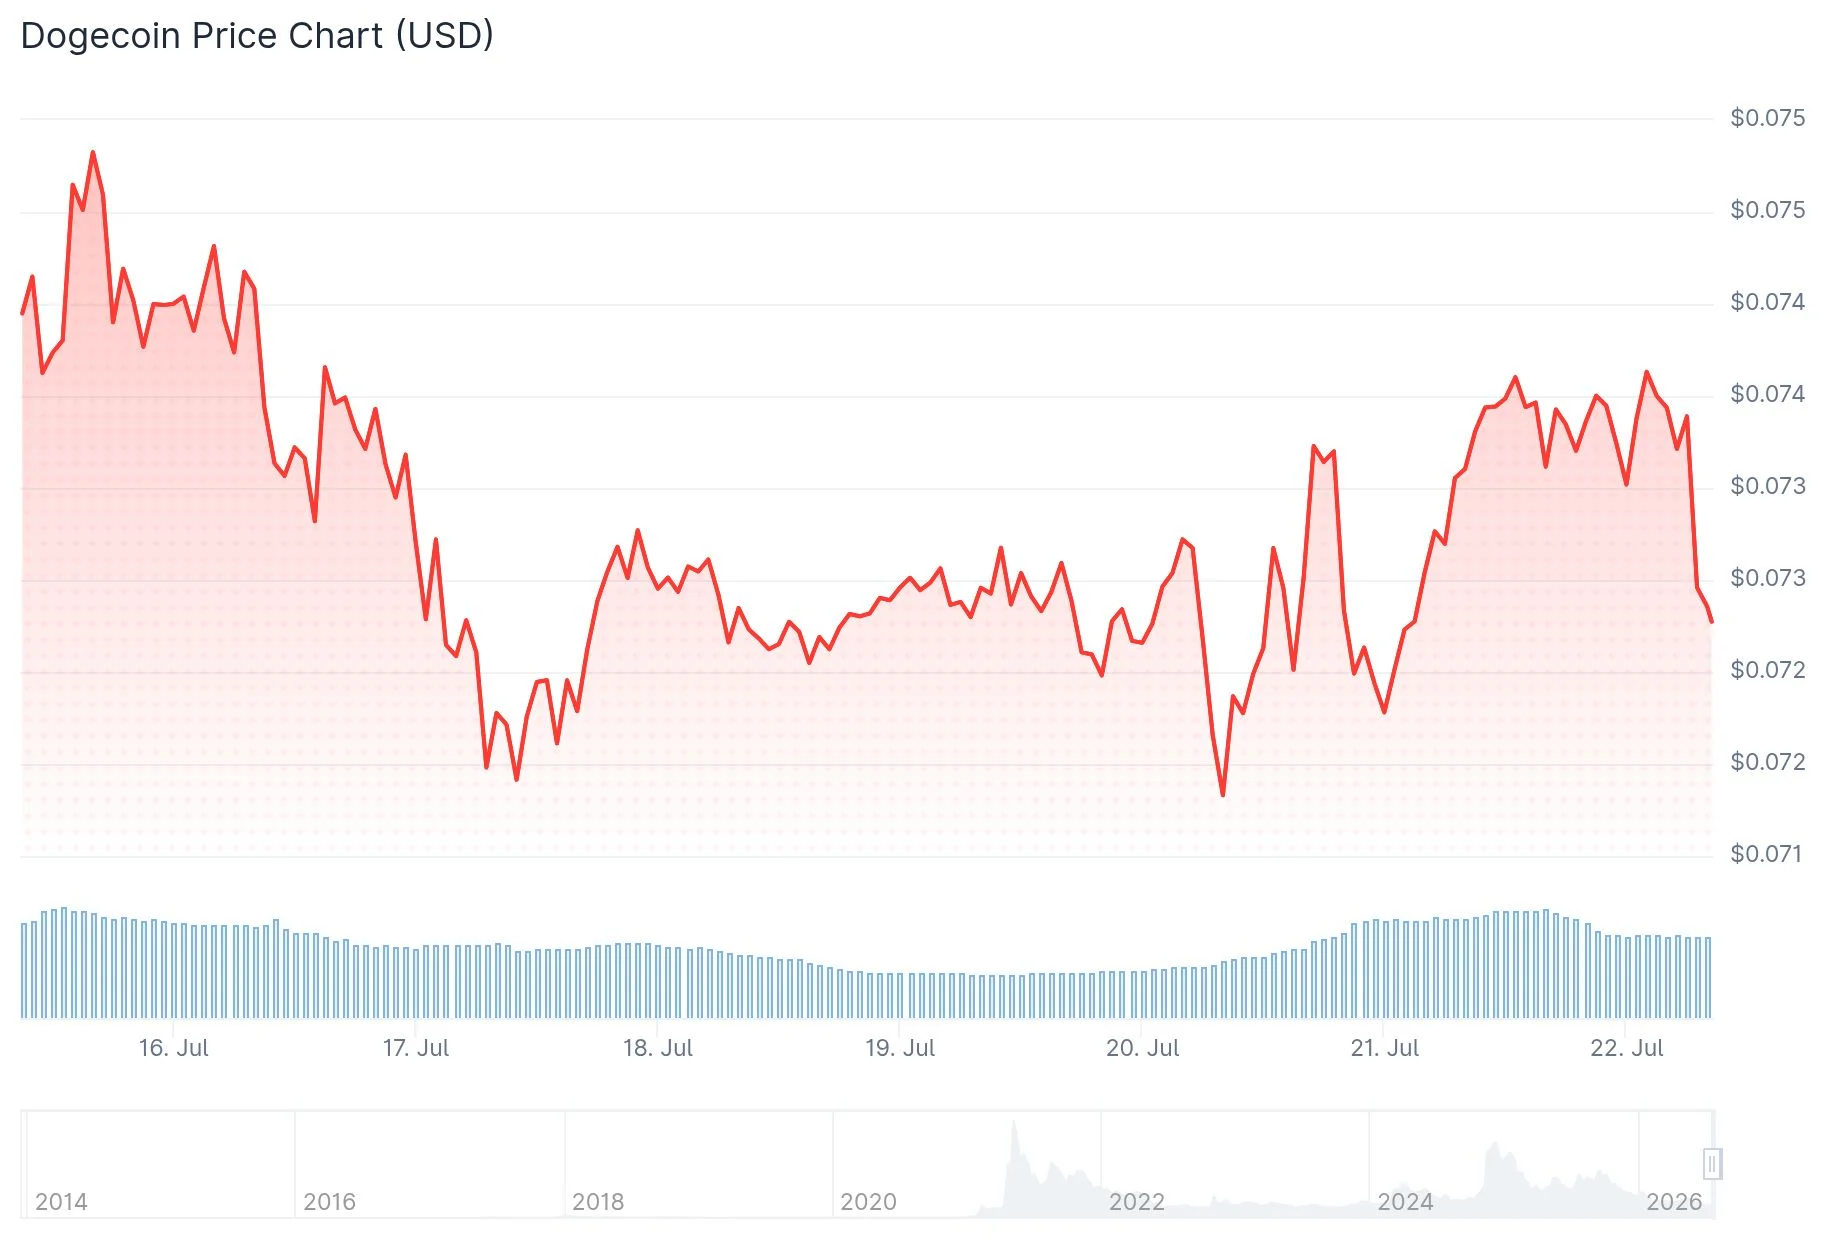
The token trades beneath its 50-day, 100-day, and 200-day exponential moving averages, currently positioned at $0.0798, $0.0877, and $0.1047 correspondingly. A decisive move above $0.075 would be required to demonstrate significant bullish momentum.
Tuesday’s Fear & Greed Index registered 25, placing it squarely within Extreme Fear range. This decline from the previous day’s reading of 29 indicates persistent caution among digital asset investors.
Nevertheless, derivatives data reveals increasing engagement. Open Interest in futures contracts expanded to 15.45 billion DOGE compared to 14.64 billion recorded one day earlier, and significantly up from 12.01 billion on June 11.
Daily trading volume surpassed $1.02 billion on Tuesday. This marks a substantial jump from Monday’s $438 million and Sunday’s $336 million, indicating heightened market participation.

The Relative Strength Index hovers around 43, while the MACD indicator shows slightly positive readings. These metrics suggest potential stabilization rather than a definitive bullish trend reversal.
Consecutive Buy Signals Emerge
Technical analyst Ali Charts shared observations on X, noting that Dogecoin continues to generate buy signals. The analyst highlights that the weekly TD Sequential indicator has now produced multiple back-to-back buy signals, characterizing this pattern as an uncommon formation that may precede a substantial upward movement.
Key support remains at approximately $0.0709, coinciding with the previous trendline breach. Should price close below this threshold on a daily basis, additional downside may follow.
Monthly Momentum Indicator Mirrors 2022 Setup
Cryptocurrency chartist Trader Tardigrade highlights an additional technical development. The monthly Stochastic RSI has descended into oversold conditions for the first occasion since the 2022 bear market cycle.
According to Tardigrade: “The monthly Stoch RSI has hit oversold and will turn up.” The analyst emphasizes parallels to 2022, when comparable readings occurred before a substantial price surge in Dogecoin.
The Stochastic RSI serves as a momentum oscillator designed to spot potential trend shifts. Market participants generally combine this indicator with price behavior and trading volume for validation.
DOGE’s price movements have consistently correlated with Bitcoin trends and overall cryptocurrency market dynamics. Active community engagement, exchange depth, and retail investor interest continue to serve as fundamental drivers beyond technical chart patterns.
Ali Charts reports that several successive weekly TD Sequential buy signals have now materialized on the DOGE price chart.
Get 3 Free Stock Ebooks
Discover top-performing stocks in AI, Crypto, and Technology with expert analysis.
- Top 10 AI Stocks - Leading AI companies
- Top 10 Crypto Stocks - Blockchain leaders
- Top 10 Tech Stocks - Tech giants



