



Key Takeaways
- Dogecoin hovers around $0.090, declining over 5% during the current week.
- Bearish positioning intensifies with the long-to-short ratio dropping to 0.68, the lowest in a month.
- The token trades beneath its 200-day EMA at $0.093, indicating weakened momentum.
- Technical analysis reveals a broadening wedge that could trigger a 20% pullback to $0.076.
- The memecoin sector’s market share relative to altcoins has plunged to an all-time low of 2.7%.
Dogecoin (DOGE) continues to face selling pressure on Wednesday, hovering around the $0.090 mark. The popular memecoin has shed more than 5% of its value over the past seven days, extending a correction phase that began in late September.
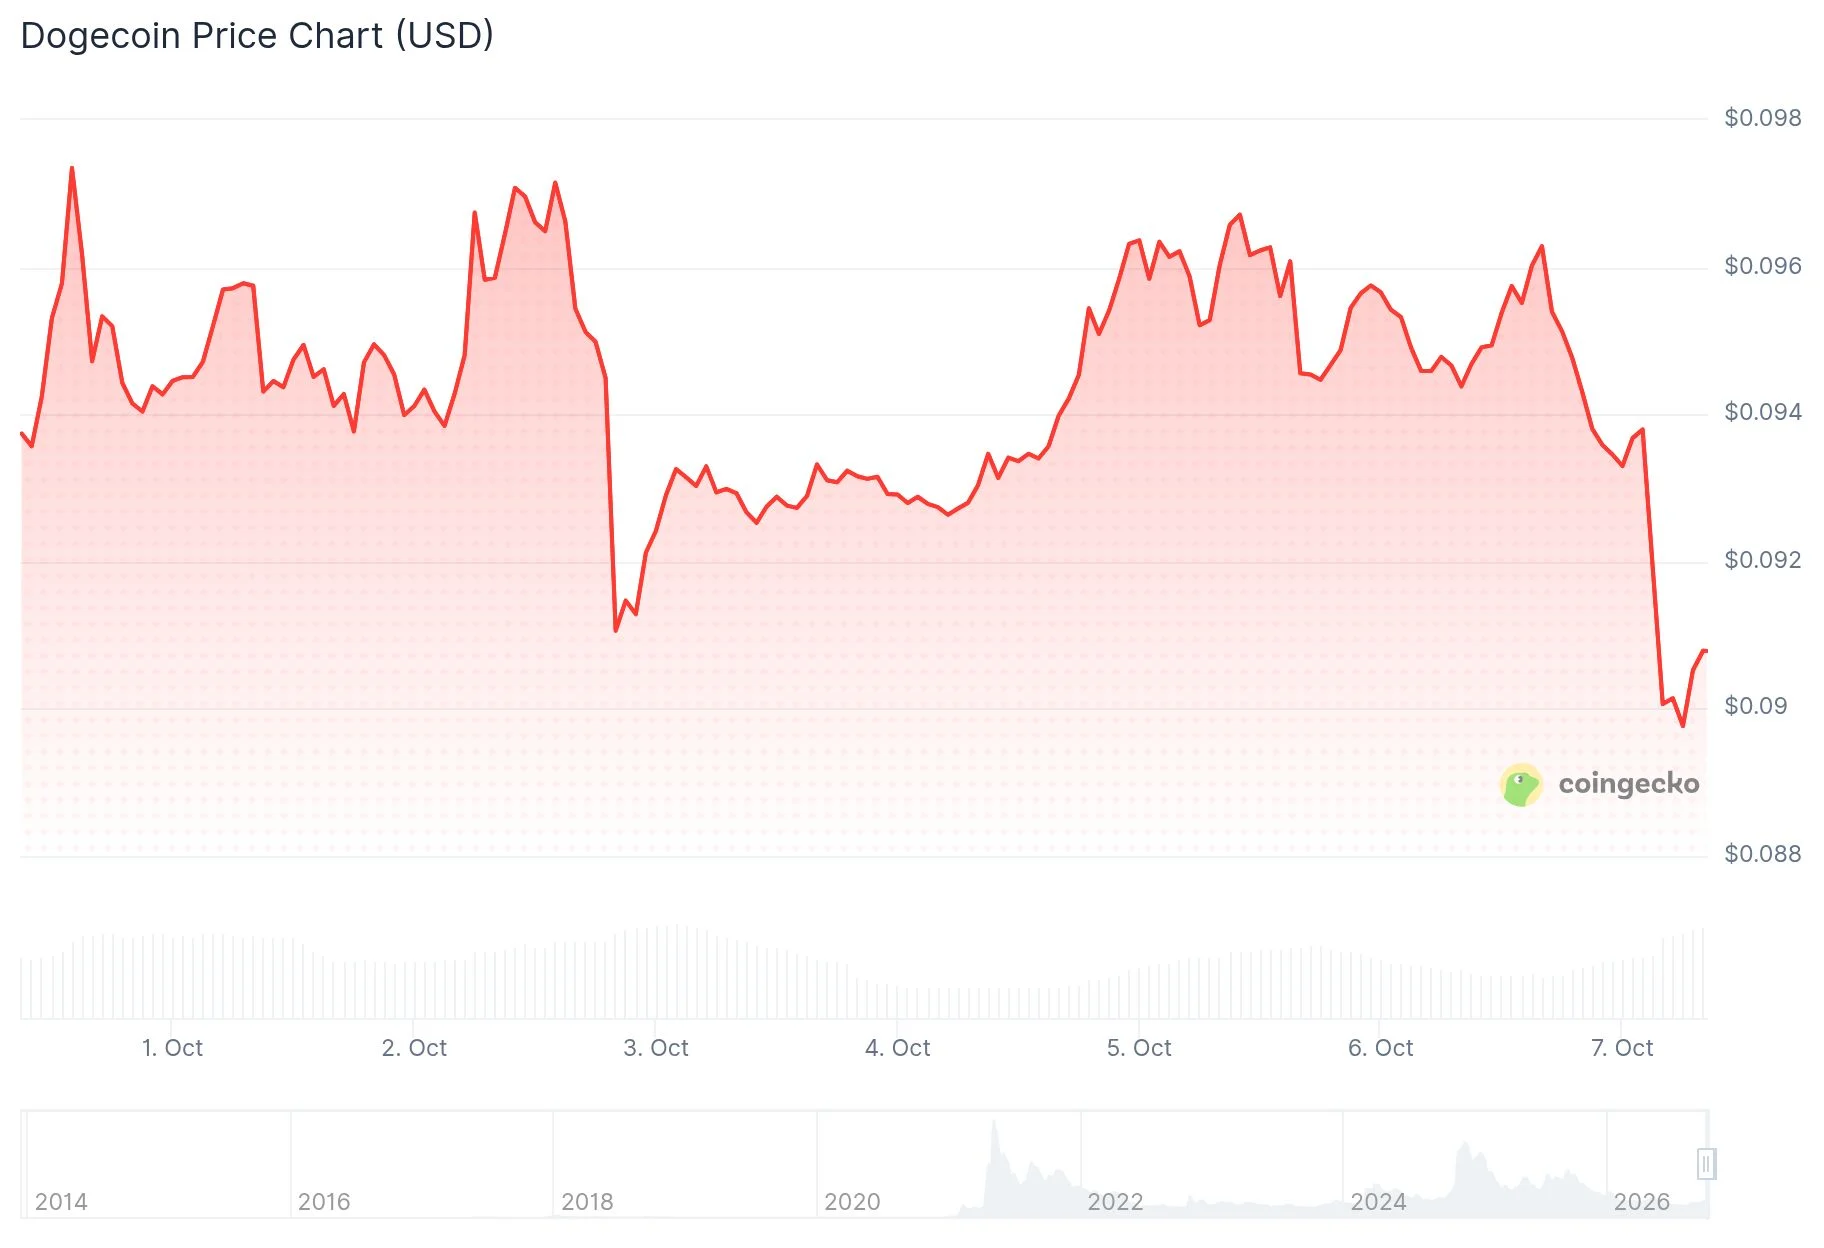
Market sentiment has turned increasingly bearish, with short positions climbing to their highest level in a month. According to CoinGlass metrics, the long-to-short ratio currently stands at 0.68. When this indicator falls below 1.0, it signals that more market participants are positioning for downward price movement.
Data from CryptoQuant confirms this pessimistic outlook. Analysis of both spot and derivatives markets reveals signs of overextension. Large whale transactions in the futures market are predominantly tilted toward sell orders, adding to the bearish narrative.
Moving Averages and Momentum Indicators Point to Weakness
Dogecoin’s price action remains trapped below a critical technical barrier—the 200-day Exponential Moving Average currently positioned at $0.093. While the token maintains its position above the 50-day EMA ($0.088) and the 100-day EMA ($0.086), this configuration suggests a delicate balance.
The Relative Strength Index registers around 48 on the daily timeframe, indicating neither overbought nor oversold conditions but leaning neutral. Meanwhile, the MACD indicator shows a slight negative reading. Together, these technical signals suggest bullish momentum is deteriorating.

Critical support converges around $0.088, where a horizontal price level aligns with the 50-day EMA. Just beneath that, the 100-day EMA at $0.086 provides an additional layer of defense. Should DOGE breach the $0.085 threshold decisively, a decline toward $0.070 becomes increasingly plausible.
For bulls to regain control, DOGE must reclaim the $0.093 level and flip it to support. Beyond that, resistance emerges near $0.102, a zone that has previously attracted selling interest from market participants.
Technical analyst Trader Tardigrade, known on social media as @TATrader_Alan, identified a concerning pattern developing on the 8-hour chart. According to the analyst’s observations, DOGE is forming lower highs around the same price zone that preceded its previous decline.
The analyst highlighted the recent swing low as a probable target for a liquidity grab. If price gets rejected at that level, it could set the stage for another attempt at higher prices. However, sustained trading below that threshold would likely push Dogecoin back into range-bound consolidation.
Ascending Wedge Pattern Suggests Deeper Correction Ahead
Additional technical evidence supports the bearish outlook. Dogecoin’s daily chart displays an ascending broadening wedge formation—a pattern that develops when price oscillations expand between two converging trendlines that slope upward.
The upper boundary of this wedge pattern extends toward $0.11, while the lower support trendline runs through the $0.090 to $0.092 range. A breakdown below this support zone could accelerate selling pressure toward $0.0871.
This price target corresponds with the 0.5 Fibonacci retracement level based on the recent upward move. If selling pressure intensifies, the next logical target sits at $0.0828, which aligns with the 0.618 Fibonacci level. The most bearish scenario would see DOGE test the $0.076 to $0.077 area, corresponding to the 0.786 Fibonacci retracement—representing approximately 20% downside from current price levels.
The daily RSI has declined to 57, reflecting a gradual loss of bullish strength. A breakout above $0.1055 accompanied by a breach of the wedge’s upper trendline would invalidate this bearish scenario.
CryptoQuant analyst Darkfost shared concerning data regarding the broader memecoin sector. According to the research, memecoin dominance compared to the overall altcoin market has collapsed to approximately 2.7%. This marks a historic low for this particular metric, highlighting how significantly memecoins have underperformed relative to other alternative cryptocurrencies.
The proliferation of new memecoin projects has fragmented trading activity across an ever-expanding universe of tokens. This dilution has made it increasingly difficult for the sector to generate the concentrated buying pressure needed to sustain rallies.
Earlier this month on October 6, DOGE was changing hands near $0.0952 before continuing its descent. The token proved unable to maintain momentum above the psychologically significant $0.10 level following its late-September surge. As of Wednesday’s trading session, Dogecoin sits at $0.09085, representing a 3.93% decline over the previous 24 hours based on current market data.
Get 3 Free Stock Ebooks
Discover top-performing stocks in AI, Crypto, and Technology with expert analysis.
- Top 10 AI Stocks - Leading AI companies
- Top 10 Crypto Stocks - Blockchain leaders
- Top 10 Tech Stocks - Tech giants



