


Key Takeaways
- DOGE is currently hovering between $0.089 and $0.090, marking approximately a 10% gain from the September 2 bottom at $0.0817.
- Technical analysts have identified a cup and handle formation on the 4-hour timeframe suggesting potential upside to $0.10.
- Price action remains positioned above crucial daily moving averages, notably the 200-day SMA currently at $0.08839.
- Spot market data indicates net buying pressure, though 4-hour capital flow metrics show minor negative readings.
- Critical resistance zone spans $0.092 to $0.0926, coinciding with the heaviest concentration of leveraged positions.
As of September 8, Dogecoin maintains its position around the $0.090 level after climbing approximately 10% from its September 2 low of $0.0817. During this recovery phase, the popular meme cryptocurrency momentarily reached $0.092 before settling into a narrow trading corridor between $0.089 and $0.091.
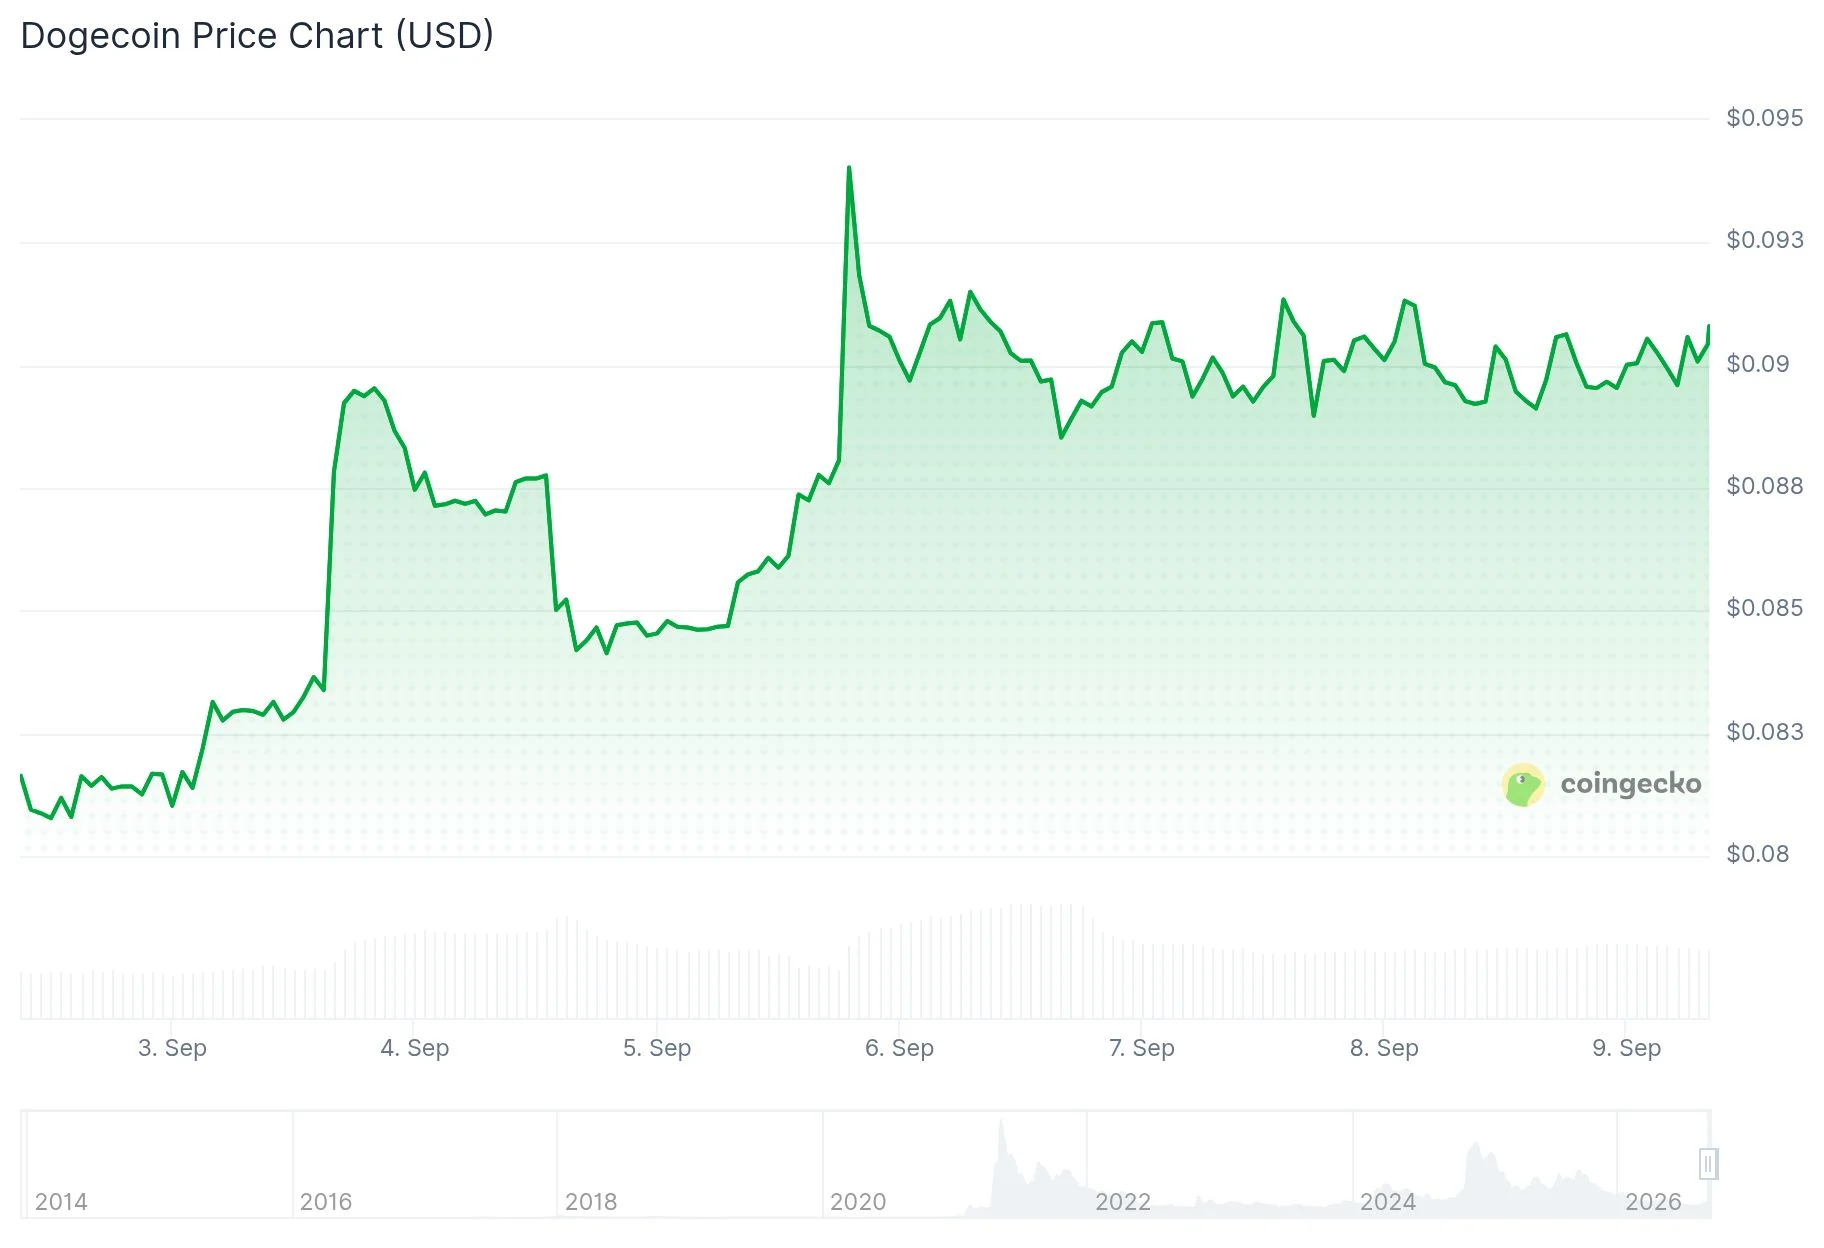
This upward movement builds upon a broader recovery trend that began when DOGE established support around $0.069 during August. That month witnessed a significant rally propelling the token beyond $0.09, although resistance near $0.095 prevented further upward progression.
According to CoinGlass spot market analytics, September 8 showed $2.92 million in excess buy-side activity compared to sell-side pressure. Binance specifically demonstrated $3.09 million more in purchasing volume versus selling activity, indicating continued buyer dominance in the spot marketplace.
Futures market indicators similarly reflect bullish sentiment. The weighted funding rate currently registers at a positive 0.0053%, demonstrating that long positions outnumber short positions among derivatives traders. Despite this optimism, open interest declined 3.36% to $1.36 billion following $4.94 million in long liquidations over the past 24 hours.
Chart Analysis: Cup and Handle Pattern Develops
The 4-hour timeframe reveals DOGE developing a textbook cup and handle formation. This pattern’s cup portion represents an accumulation phase, while the handle demonstrates price compression beneath resistance as volatility diminishes.

Technical analyst Trader Tardigrade drew attention to this configuration via social media, explaining that a convincing break above the handle’s trendline—accompanied by increased volume and sustained momentum—could propel prices toward the $0.10 threshold. He emphasized that without proper confirmation, DOGE will likely remain range-bound and potentially revisit lower support zones.
The Relative Strength Index currently reads 54, maintaining a slight bullish bias, although the RSI line trails below its signal line, indicating diminishing momentum strength. Bollinger Bands are contracting, which typically signals an extended consolidation period ahead.
Examining the daily timeframe, DOGE maintains positions above its 20-day SMA at $0.08713, along with the 50-day, 100-day, and 200-day SMA anchored at $0.08839. The MACD line registers 0.00336, marginally exceeding the signal line’s 0.00321 reading, preserving bullish momentum by a slender margin.
Critical Price Zones and Liquidation Data
CoinGlass’s three-day liquidation heatmap reveals the most concentrated cluster of leveraged positions residing between $0.092 and $0.0926. Secondary liquidity pools exist around $0.094 and $0.0965.
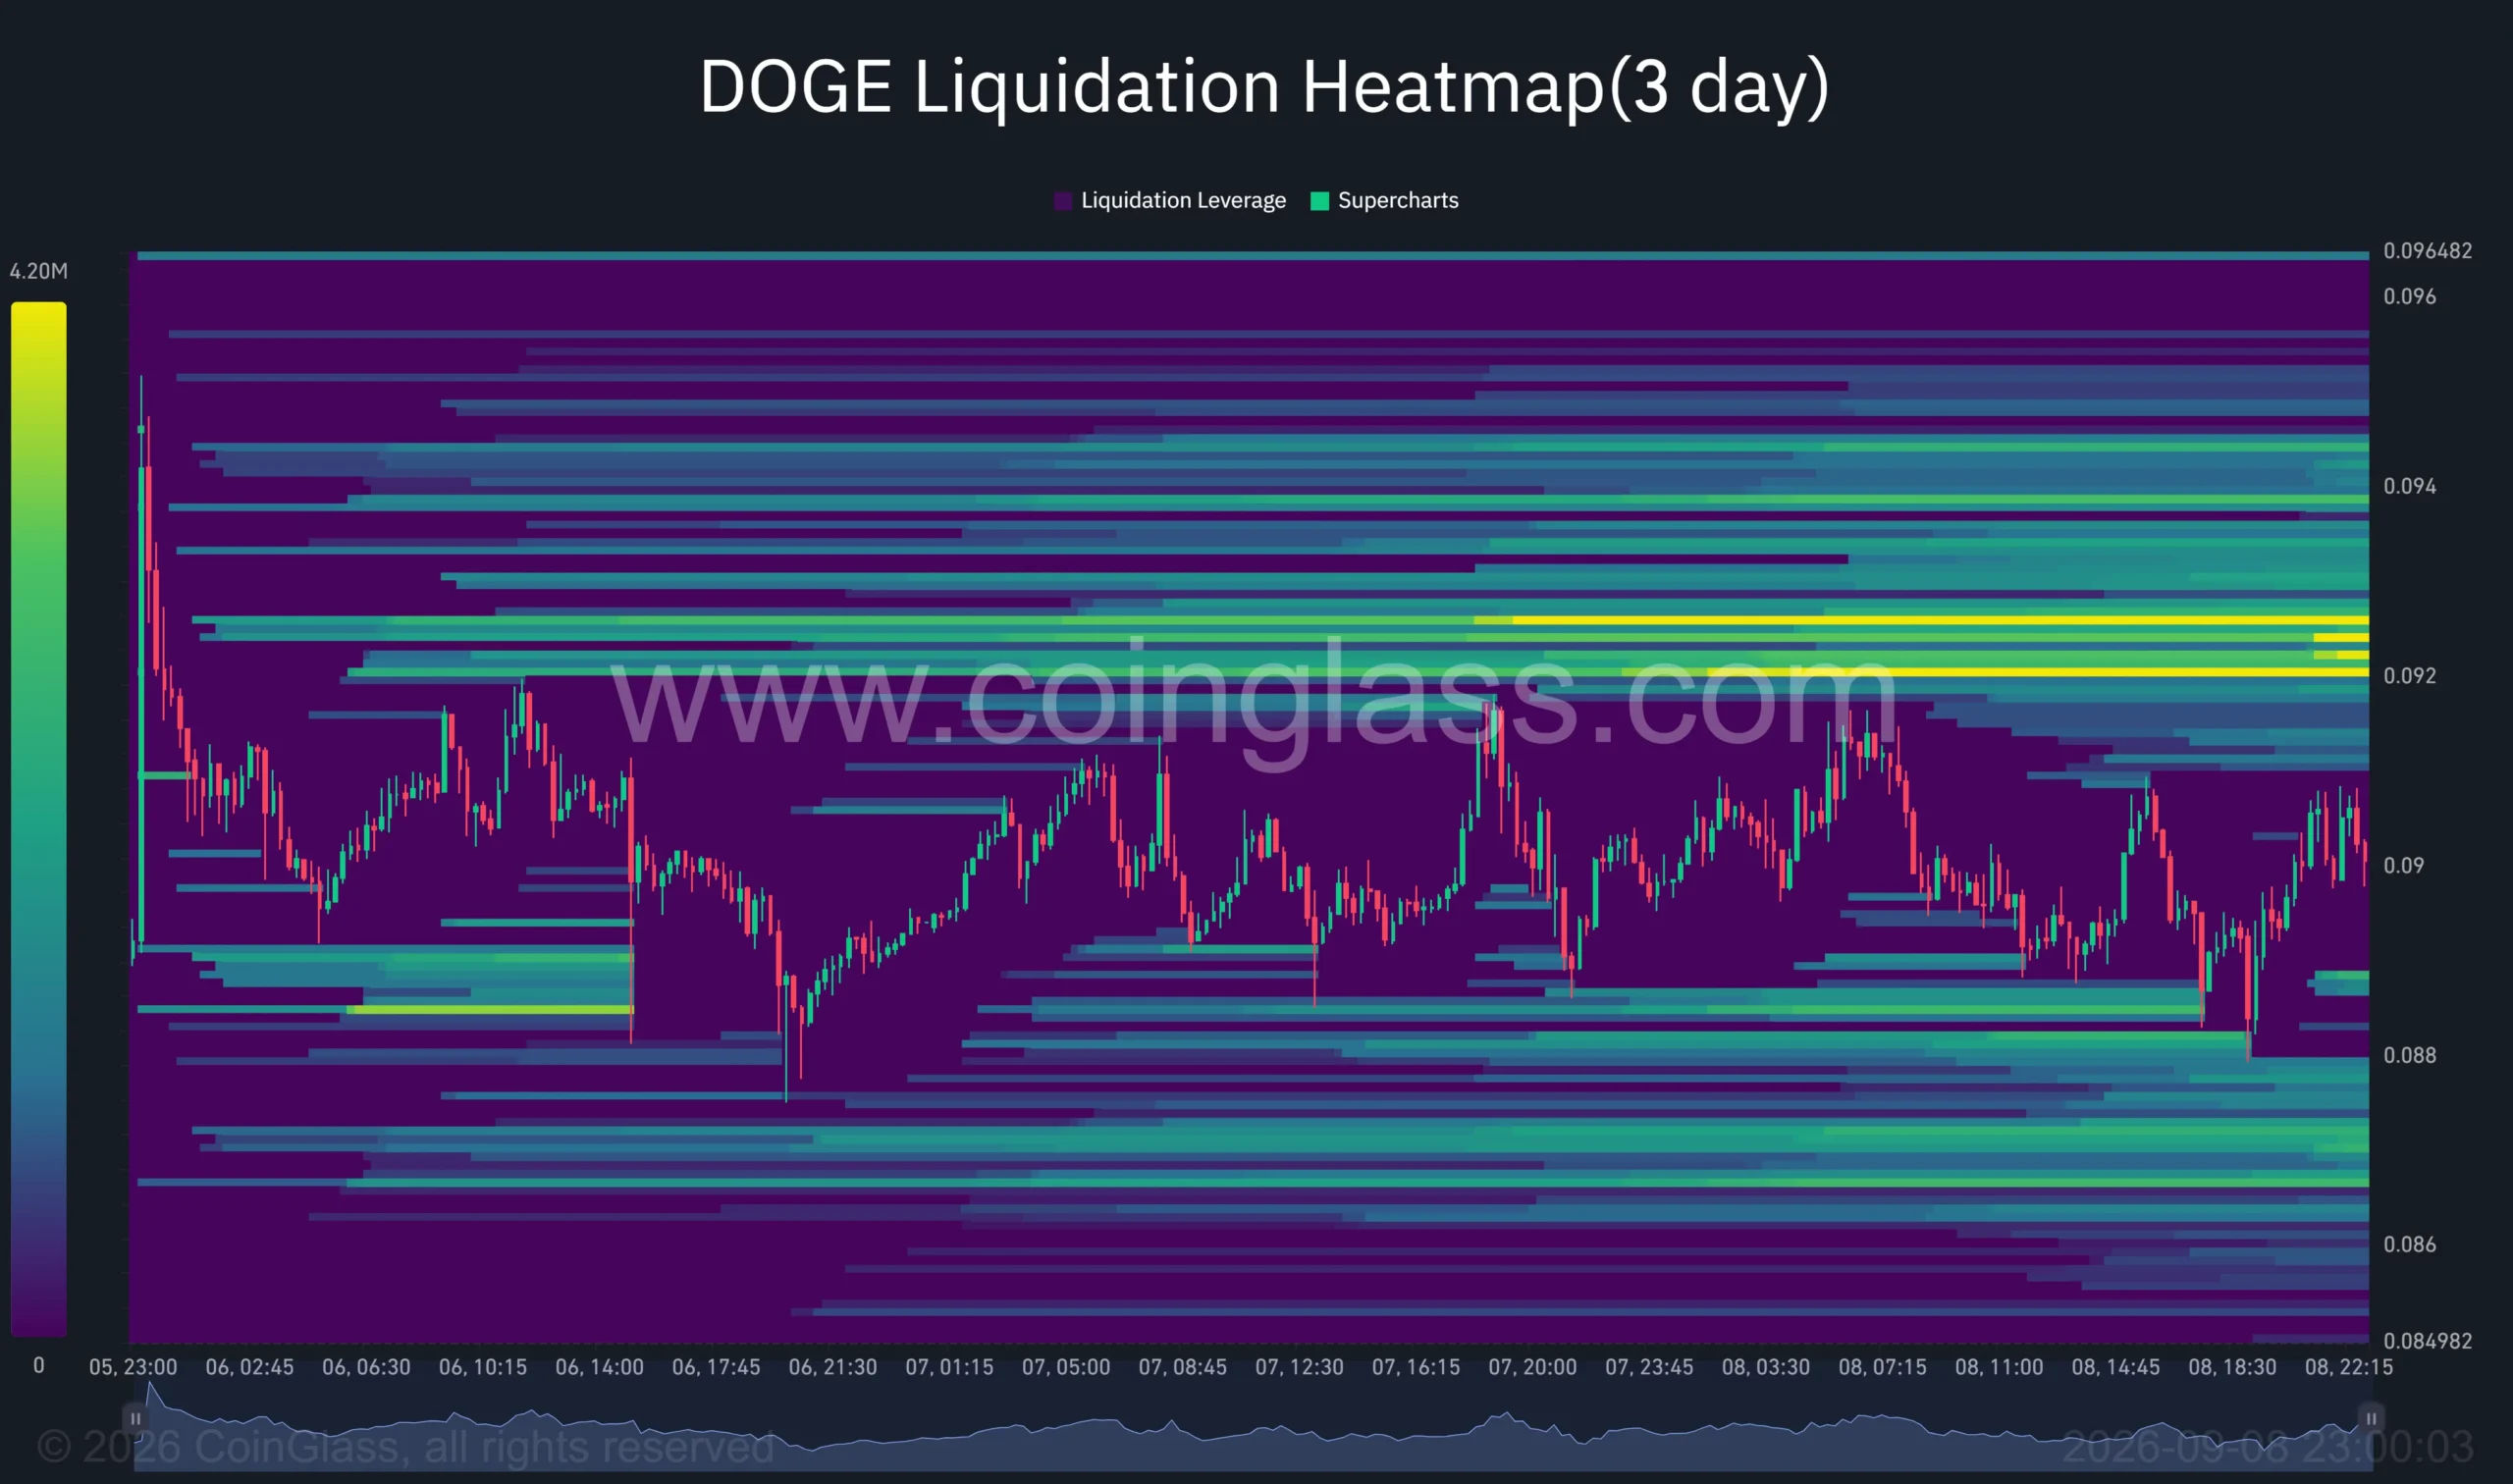
Successfully penetrating the $0.0926 barrier would bring $0.094 into focus, a level where DOGE encountered multiple rejections throughout late August. Breaking above that resistance could unlock pathways to $0.0965 and ultimately $0.10.
Downside support levels include the 200-day SMA around $0.0884 and the 20-day SMA near $0.0871. The 4-hour Supertrend indicator identifies support at $0.0847.
The 4-hour Chaikin Money Flow indicator displays a reading of minus 0.05, reflecting moderately negative capital flow dynamics. Additionally, DOGE-focused exchange-traded funds experienced $343,580 in net outflows during the August 31 to September 4 period, breaking a two-week streak of positive inflows.
Get 3 Free Stock Ebooks
Discover top-performing stocks in AI, Crypto, and Technology with expert analysis.
- Top 10 AI Stocks - Leading AI companies
- Top 10 Crypto Stocks - Blockchain leaders
- Top 10 Tech Stocks - Tech giants



