
 Eyes $0.10 Breakout as $296M Short Positions Face Risk")
Key Highlights
- Dogecoin climbed 2% to reach $0.086, surpassing XRP in OKX trading volume with $38M compared to XRP’s $30M.
- Large-scale investors acquired more than 200 million DOGE tokens during the June 4–8 period, per analyst Ali Martinez.
- The crucial $0.081 support zone has remained intact for 28 months; a breach could trigger a decline toward $0.058.
- Approximately $296 million worth of short positions risk forced liquidation if DOGE climbs to $0.10.
- Martinez presents two potential outcomes: a rally toward upper targets, or an additional 32% decline to $0.058.
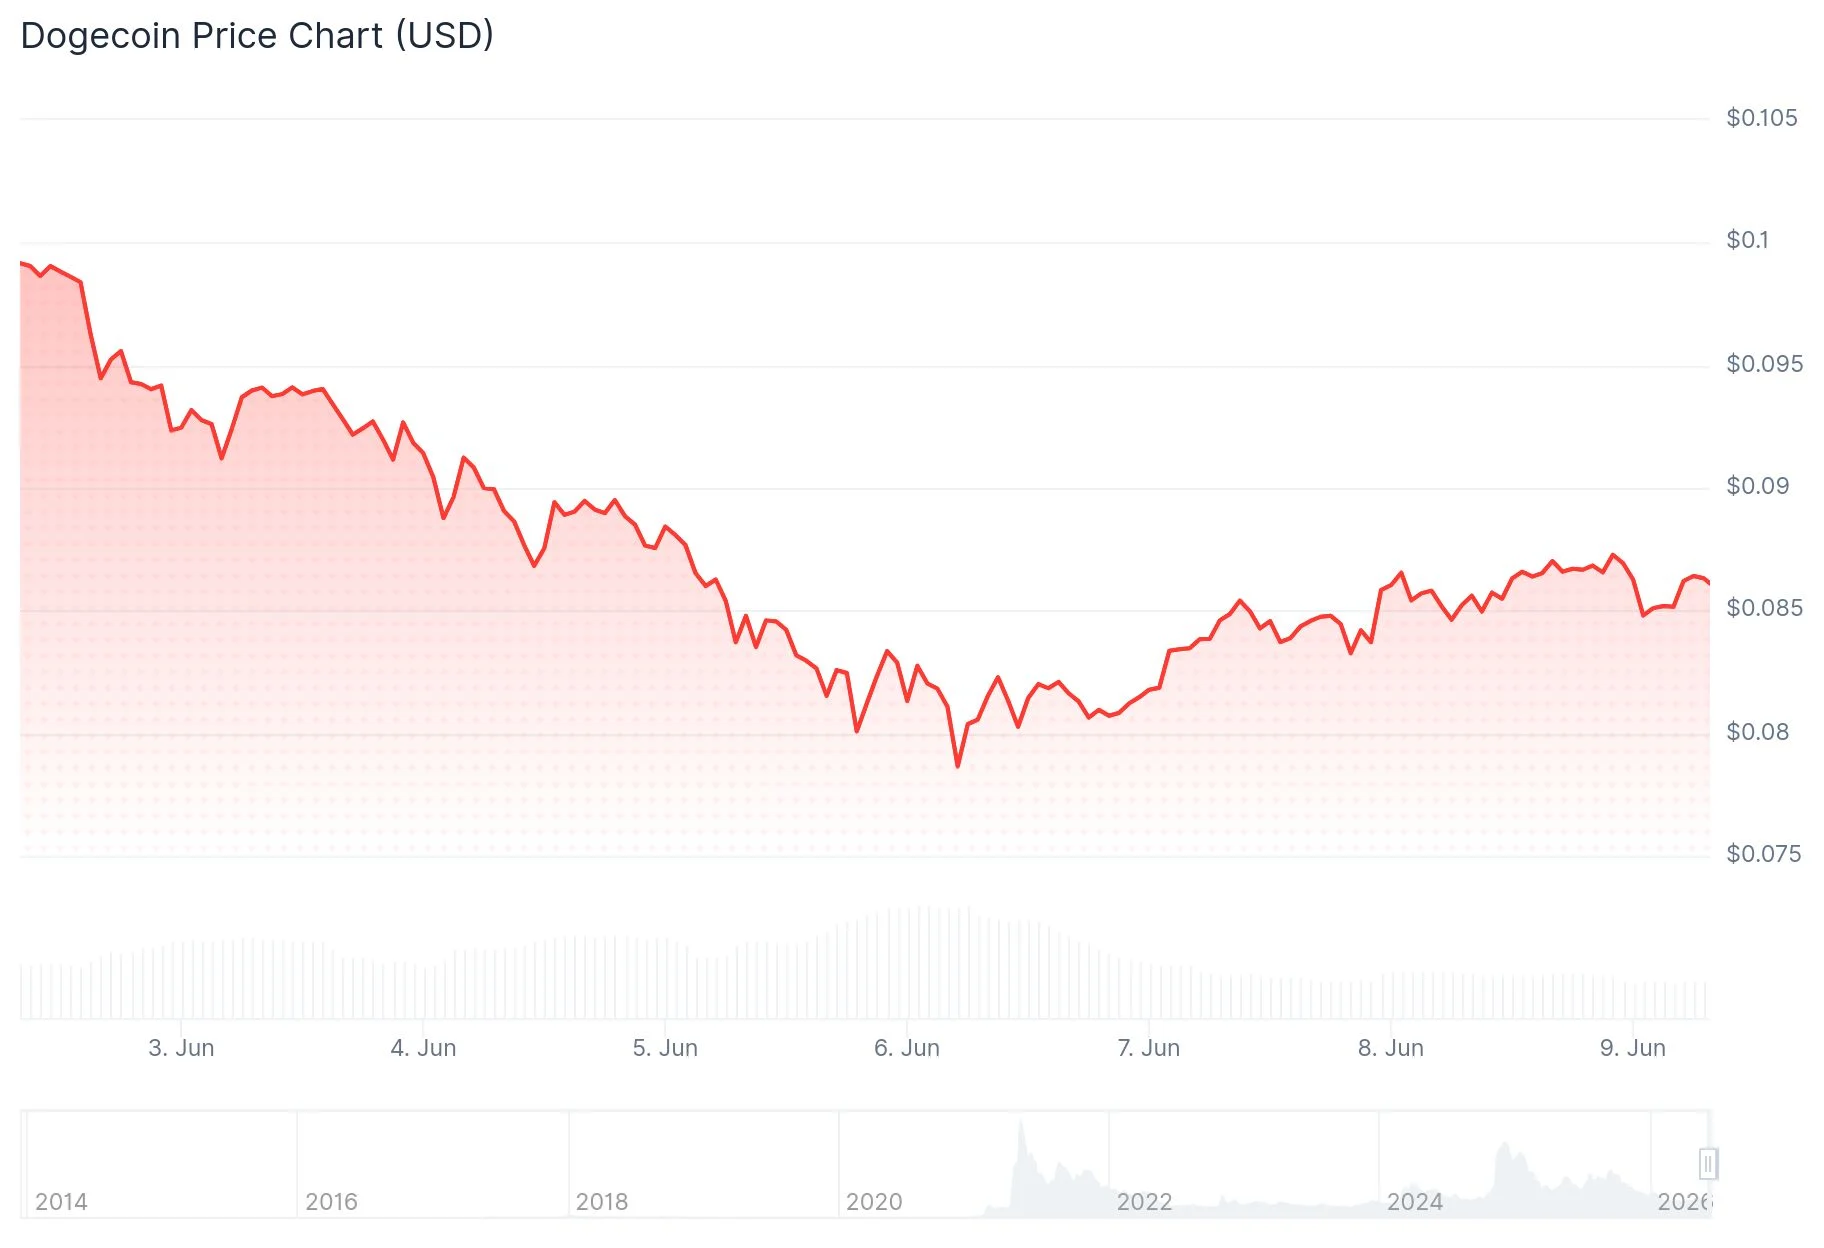
Dogecoin has posted a 2% increase over the past 24 hours, currently trading at $0.086 as of June 8, 2026. This uptick follows a weekend dip to a multi-year bottom of $0.077, from which the memecoin has since recovered.
Crypto analyst Ali Martinez shared a chart on X highlighting that over 30 billion DOGE tokens last changed hands at the $0.081 price point. He characterized this as “a massive historical cluster of spot exposure, creating strong psychological and financial support.” According to Martinez, this concentration of transactions makes it challenging for sellers to drive prices below this critical zone.
Blockchain data reveals significant whale activity, with accumulation exceeding 200 million tokens between June 4 and June 8. Growing trader engagement is also reflected in spot trading volume metrics.
On the OKX trading platform, the DOGE/USDT trading pair generated $38 million in volume on June 8. This performance placed DOGE ahead of XRP, which registered $30 million. DOGE accounted for 5% of total OKX volume that day, securing the eighth position among all trading pairs, while XRP landed at 13th with a 1.58% market share.
Part of this volume surge may be connected to speculation surrounding the upcoming SpaceX IPO set for June 12, which market participants have historically linked to increased Dogecoin buying activity due to Elon Musk’s public support.

Ali Martinez Outlines Two Possible Paths
Martinez characterized DOGE as positioned at a “critical structural inflection point.” He referenced a five-year parallel channel pattern visible on the chart, with $0.081 representing the lower mid-range boundary and $0.058 marking the absolute channel base.
In his bullish scenario, the $0.081 support zone holds firm, selling pressure gets absorbed, and DOGE gradually climbs toward the upper channel targets. In the bearish alternative, should macroeconomic headwinds intensify and DOGE closes a weekly candle beneath $0.081, he anticipates a correction lower toward $0.058 — representing an additional decline of approximately 32%.
The weekly chart’s RSI indicator currently reads 35, signaling continued weak momentum. Nevertheless, the indicator has stabilized at this level, potentially providing an opportunity for buyers to establish positions.
Potential Short Squeeze at $0.10 Level
Liquidation data from Coinglass indicates that $296 million in short positions would be automatically closed if DOGE pushes up to $0.10. This price point represents a significant psychological resistance barrier.
The liquidation map reveals a pronounced imbalance, with substantially more short exposure than long exposure concentrated around the current price zone. This asymmetric positioning increases the probability of a move toward $0.10 as trading volumes expand.
The $0.081 support level has proven resilient since February 2024, with DOGE bouncing from this floor on three separate occasions during that period. A decisive break above $0.11 would negate the descending triangle formation visible on the weekly timeframe and establish a more constructive long-term technical outlook.
As of June 9, 2026, DOGE is changing hands at $0.086, with the $0.10 mark serving as the next significant upside target and $0.081 remaining the essential support level to monitor.
Get 3 Free Stock Ebooks
Discover top-performing stocks in AI, Crypto, and Technology with expert analysis.
- Top 10 AI Stocks - Leading AI companies
- Top 10 Crypto Stocks - Blockchain leaders
- Top 10 Tech Stocks - Tech giants


