



Key Takeaways
- XRP continues trading above ascending triangle support established over eight years.
- The cryptocurrency reached $1.13 with July gains exceeding 9%.
- Consistently higher lows since 2017 maintain the bullish long-term chart formation.
- Primary Fibonacci support zone sits at $0.8369, with $1.5620 marking the next significant resistance.
- ChartNerdTA identified robust buy signals on shorter timeframes alongside sell signals on extended weekly and monthly intervals.
- The technical analyst emphasized that extended oversold conditions can present opportunities for market participants.
XRP reached approximately $1.13 following July gains surpassing 9%, maintaining position above a multi-year ascending support trend that has held through various market cycles. Trading data revealed the month began near $1.0385, peaked at $1.1828, touched a low of $1.0210, and subsequently bounced back.
Monthly chart analysis continues revealing XRP trading within an ascending triangle formation established since 2018. Market observers find this structure compelling as price action repeatedly creates higher lows while encountering a persistent resistance zone. The formation maintains focus on elevated Fibonacci extension targets should XRP complete a decisive breakout.
Eight-Year Ascending Triangle Remains Valid for XRP Price
The monthly timeframe displays an ascending triangle pattern active for approximately eight years. The lower boundary connects progressively higher lows established following the 2017 bull cycle, encompassing pullbacks throughout 2019, 2020, and 2022.
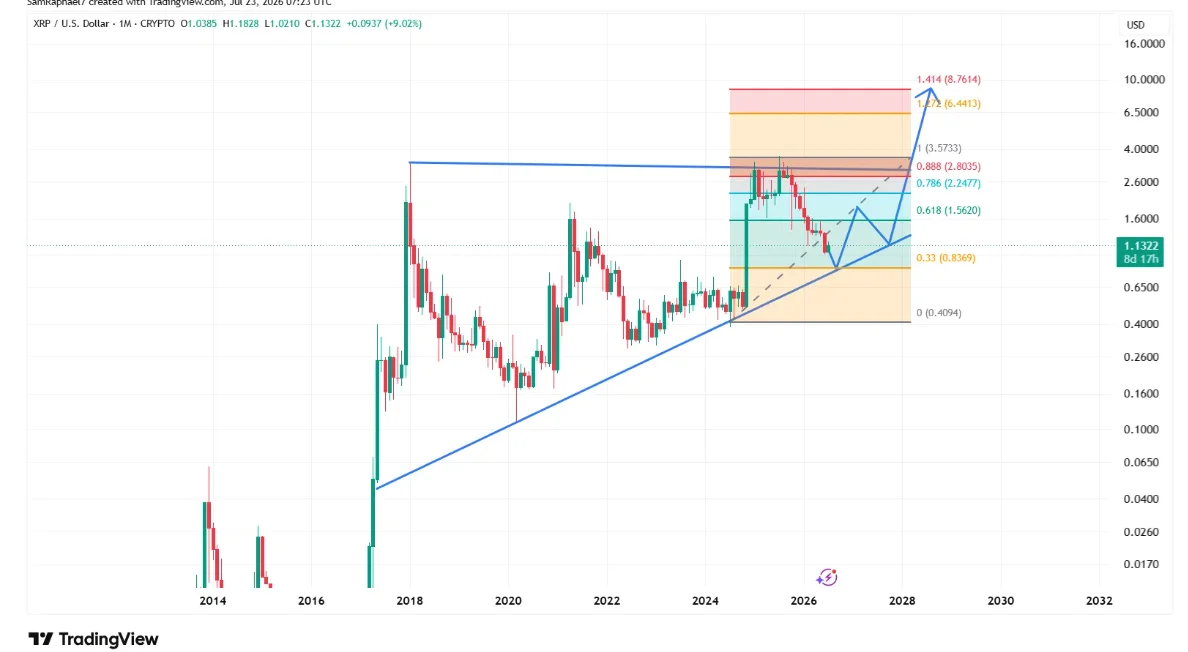
Each downward correction concluded above preceding lows. This consistent behavior demonstrates that buyers maintained accumulation at increasingly elevated price points across multiple market cycles.

Meanwhile, the upper boundary has served as persistent resistance dating back to the 2018 apex near $3.30. Subsequent major rallies encountered rejection around this identical resistance region before retreating.
XRP broke through that resistance throughout 2024 and subsequently surged past $3.60 during July 2025. The token has since retraced during the present correction while sustaining position above the ascending support line forming the triangle’s foundation.
Multi-Timeframe XRP Price Analysis Reveals Contrasting Signals
Technical analyst ChartNerdTA examined XRP across various trading intervals and identified divergent signals depending on chart duration. The analyst’s findings indicate shorter timeframes currently exhibit stronger bullish conditions compared to extended-term charts.
The analyst observed, “$XRP is showing strong buy signals from the 30-minute through daily charts, while the weekly and monthly charts still show strong sell ratings.”
ChartNerdTA further mentioned that extended-term bearish readings warrant careful interpretation rather than immediate concern. The analyst explained, “The macro strong sell is a reminder to capitalize on oversold conditions rather than fear missing opportunities.”
Supplementary chart commentary noted that prior daily strong-buy signals frequently emerged during short-lived bounces before broader downtrends resumed. The analyst highlighted that enhanced weekly momentum would be required before validating a substantial trend reversal.
Fibonacci Levels Define Critical XRP Price Zones
Fibonacci retracement analysis measures XRP’s advance from $0.4094 to $3.5733. Current XRP price action positions the token between the 0.33 retracement at $0.8369 and the 0.618 retracement at $1.5620.
The $0.8369 threshold represents the primary support zone throughout the current retracement. Maintaining ground above this area preserves the broader bullish formation while price operates within the long-established triangle.
The subsequent resistance emerges at $1.5620. A monthly close surpassing that threshold would direct attention toward the 0.786 Fibonacci level at $2.2477 and the 0.888 level at $2.8035.
These price thresholds carry significance as they represent intermediate zones between current valuation and the prior cycle peak. Market participants frequently track these retracement areas for indications of directional shifts.
Extension Targets Emerge Above $3.57 Resistance Zone
The 1.0 Fibonacci level at $3.5733 corresponds with the ascending triangle’s upper boundary. This region functioned as resistance during the 2018 market culmination and also contained the breakout effort throughout 2024.
A verified monthly close above $3.5733 would shift focus toward elevated Fibonacci extension levels. The initial extension objective stands at $6.4413, calculated from the 1.272 Fibonacci extension.
The subsequent extension target materializes at the 1.414 Fibonacci extension near $8.7614. These objectives gain relevance exclusively following a confirmed breakout above the multi-year resistance that has constrained upward price movement for extended periods.
Get 3 Free Stock Ebooks
Discover top-performing stocks in AI, Crypto, and Technology with expert analysis.
- Top 10 AI Stocks - Leading AI companies
- Top 10 Crypto Stocks - Blockchain leaders
- Top 10 Tech Stocks - Tech giants



