



Key Takeaways
- ADA maintains position around $0.16, staying above critical weekly demand zone spanning $0.14–$0.17
- Weekly RSI indicators have plunged to historically oversold territory not seen in previous cycles
- Technical analysts identify developing inverse head-and-shoulders formation awaiting confirmation
- Primary resistance zone lies between $0.224–$0.236; successful breach could propel price toward $0.31
- Technical projections place fair value around $0.56, with extended targets reaching $4.55
Cardano (ADA) currently exchanges hands at approximately $0.16, reflecting a 1.88% decline in the last 24-hour period. The cryptocurrency maintains a market capitalization hovering near $6.07 billion, accompanied by daily transaction volume of roughly $188 million.
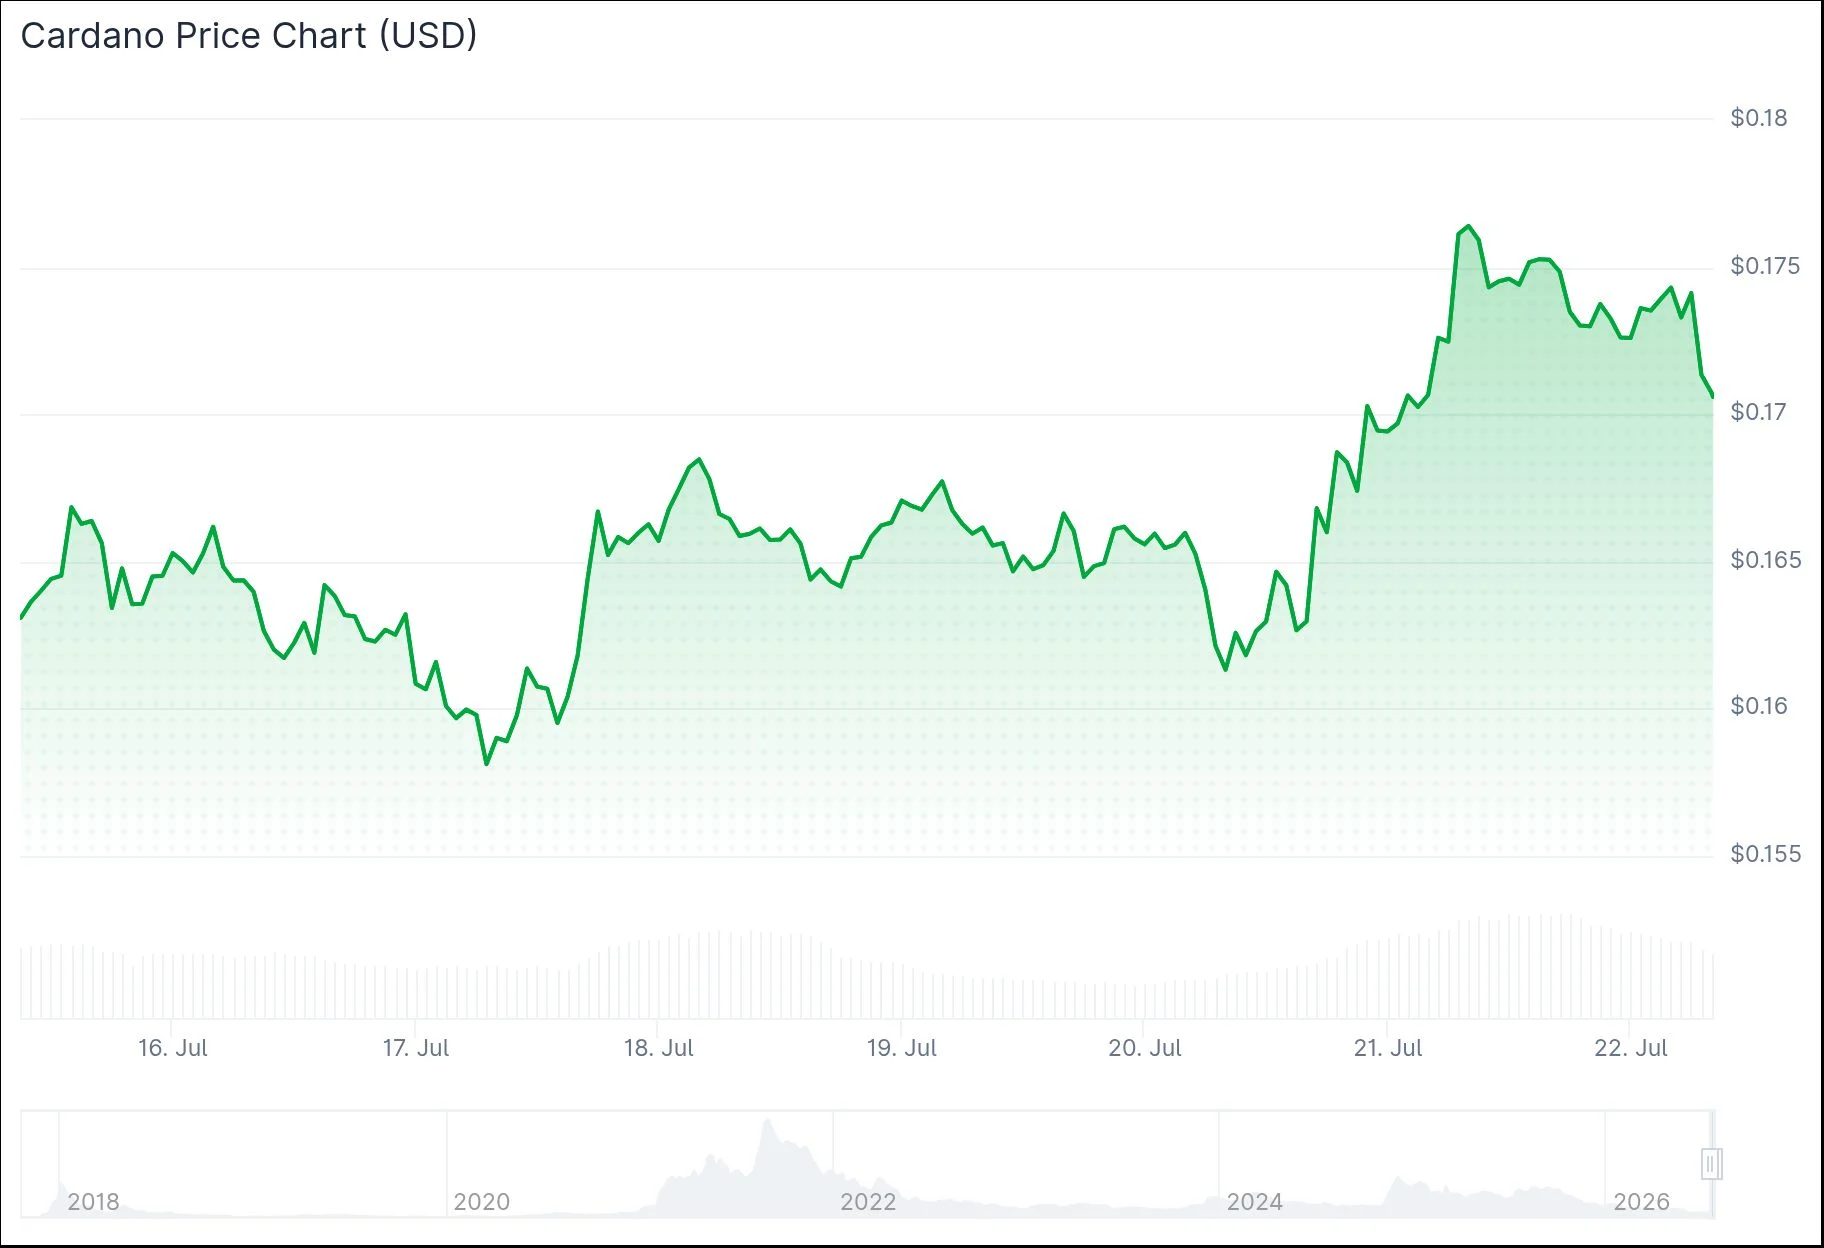
The digital asset currently rests just above a significant weekly demand region that market observers have been monitoring intently. This critical zone extends from $0.14 through $0.17 and has consistently absorbed selling pressure during recent price declines.
While bearish sentiment persists in the market, successive downward moves are demonstrating diminishing strength. Technical analysts interpret this behavior as a potential indication that sellers are exhausting their control.
Market analyst Master of Crypto highlighted on X that ADA has been establishing a series of higher lows within an ascending channel structure. According to his assessment, the price now trades above $0.175 following a bounce from support, positioning the next objective near $0.219—representing approximately 25% upside potential from present levels.
Weekly RSI Indicator Plunges to Historical Extremes
Cardano’s weekly Relative Strength Index has descended to one of its deepest oversold zones in the asset’s trading history. Technical analyst Quantum Ascend drew attention to this condition on X, identifying $0.14 as the crucial support threshold and $0.236 as the primary resistance barrier for any potential rally.

While extreme oversold RSI conditions don’t automatically trigger price reversals, they frequently emerge when downward momentum reaches exhaustion points. These zones can present improved risk-reward ratios for market participants considering long positions.
Should ADA sustain trading above the $0.14 threshold, the bottoming formation remains viable. Conversely, a decisive breakdown beneath this level would likely direct the token toward the subsequent support region around $0.10.
Classical Bullish Pattern Takes Shape
Technical specialist CryptoJack has detected a potential inverse head-and-shoulders configuration emerging on shorter timeframes. The pattern’s components—left shoulder, head, and right shoulder—are materializing within the $0.16–$0.17 price corridor.
This formation remains unconfirmed at present. ADA must successfully penetrate above the neckline established by recent swing peaks to validate the pattern.
Upon confirmation, initial upside objectives would encompass the $0.18–$0.19 region, followed by the $0.224–$0.236 resistance cluster. Chart analyst The Boss has outlined additional upside milestones at $0.3136, $0.3825, and $0.4488 based on weekly timeframe analysis.
Another market technician calculated ADA’s theoretical fair value at $0.56 using their proprietary indicator framework. This same analysis pinpointed a support corridor between $0.11 and $0.17 that has endured multiple tests dating back to 2022.
On the daily timeframe, the immediate resistance barrier emerges around $0.23. Should buying interest intensify beyond that level, ADA could advance toward $0.32, according to this technical perspective.
Weekly momentum indicators have yet to demonstrate a decisive surge in accumulation activity, leaving the sustainability of any upward trajectory subject to question in the near term.
Get 3 Free Stock Ebooks
Discover top-performing stocks in AI, Crypto, and Technology with expert analysis.
- Top 10 AI Stocks - Leading AI companies
- Top 10 Crypto Stocks - Blockchain leaders
- Top 10 Tech Stocks - Tech giants



