



Key Highlights
- BNB surged past the $700 threshold in August, recording an impressive 18% gain over seven days
- Technical analysts identify $725 as the crucial barrier that must fall for continuation
- The Relative Strength Index has climbed into overbought zones, registering between 70 and 80
- Wave theory suggests BNB could reach anywhere from $780 to $1,190 in its next leg up
- Trader Rand Group highlighted that maintaining above $670 on monthly timeframes signals bullish continuation
BNB mounted an aggressive recovery in mid-August, vaulting from approximately $590 to beyond $700 in a matter of days—marking one of the token’s most powerful upward moves in 2025. According to CoinGecko tracking, BNB settled at $707.48 on August 26, while CoinLore recorded a close of $712.16 the following day after touching an intraday peak of $714.88.
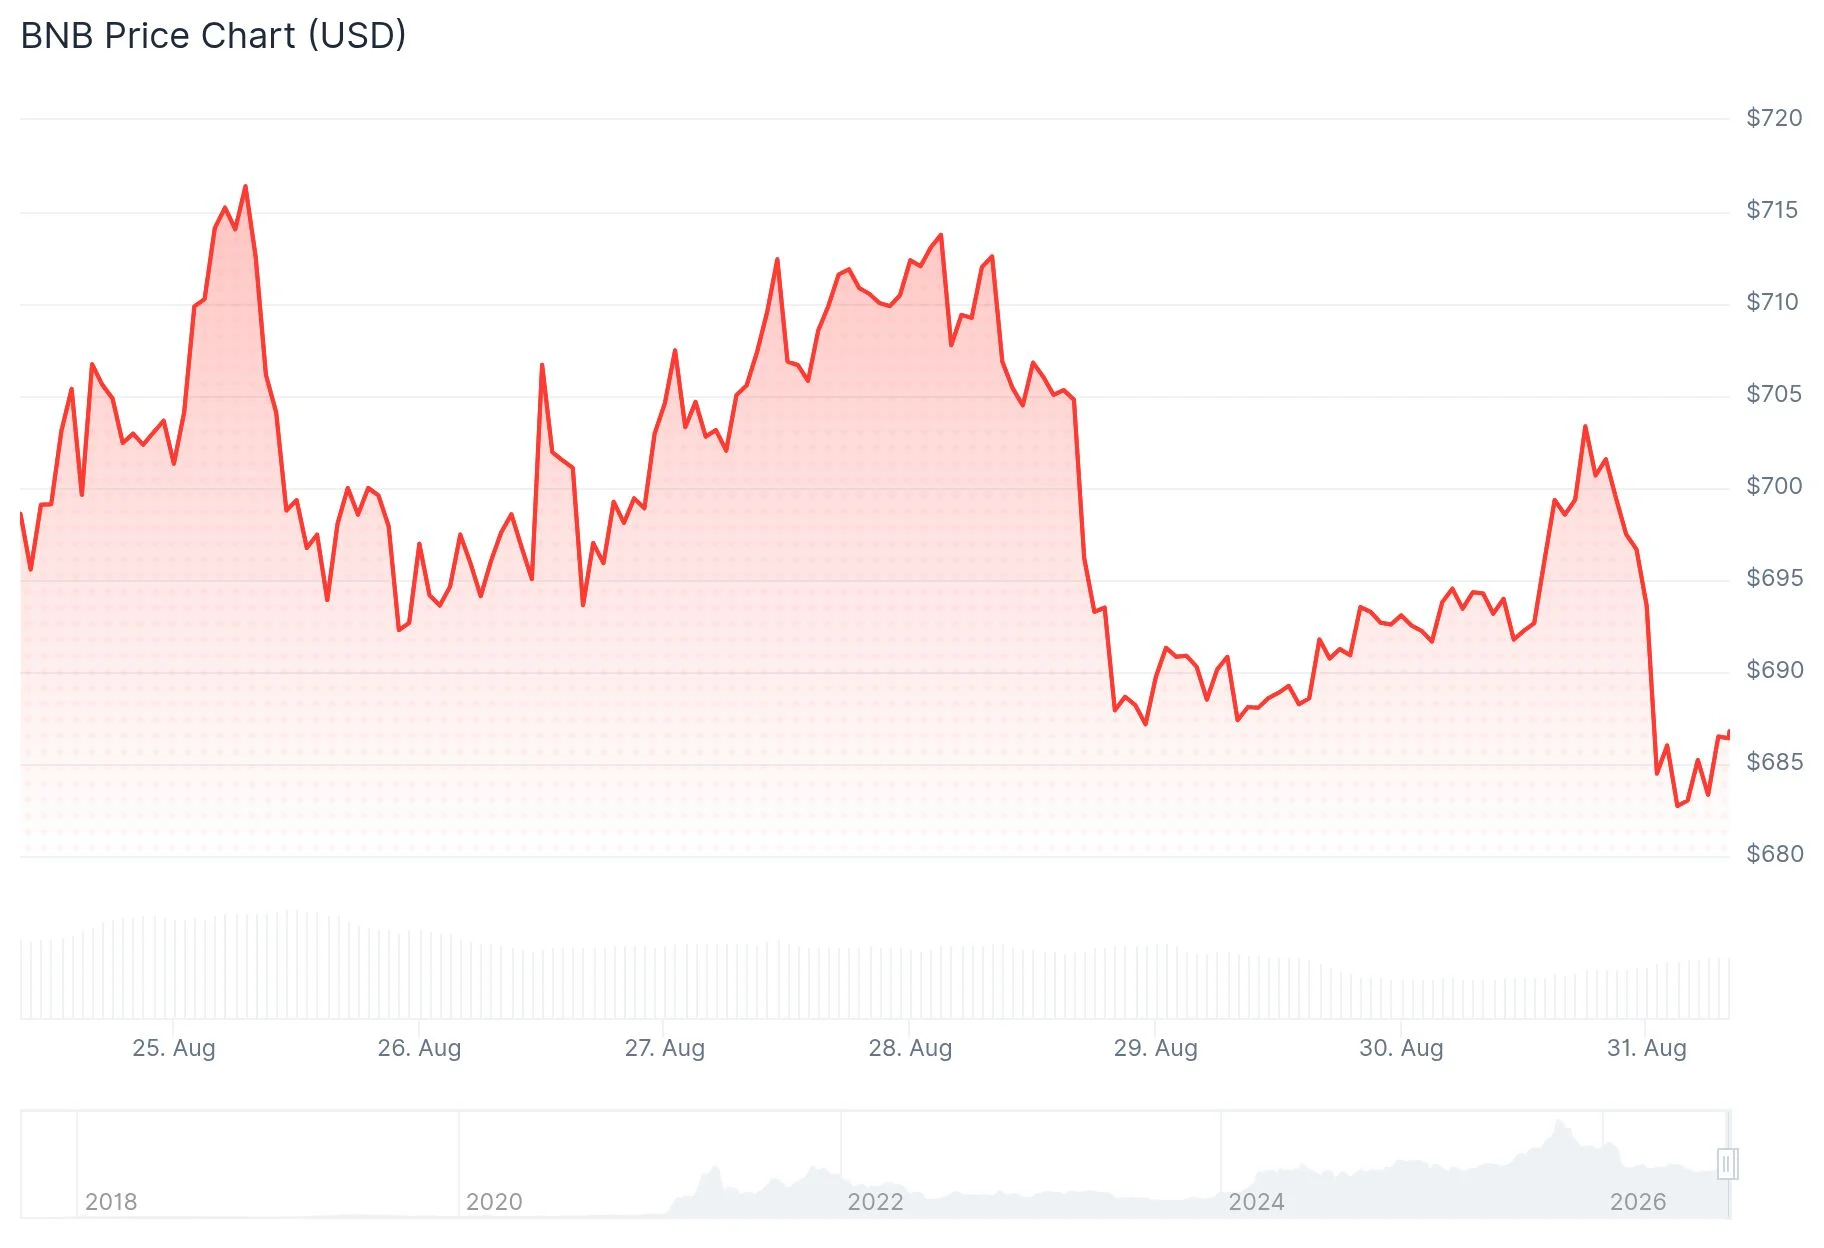
This surge elevated BNB’s valuation back toward the $94 billion market capitalization threshold. Despite this strong performance, the token remains substantially below its historical peak of $1,373.40, representing approximately 92% potential upside from current trading levels.
The advance coincided with a broader shift in cryptocurrency market sentiment. According to Benzinga reporting, institutional positioning flipped to “extremely bullish” on August 25—the first occurrence of such extreme optimism during this market cycle. Bitcoin was testing the $80,000 level while the Fear and Greed Index registered its most optimistic reading since January.
Trading volume powered BNB through seven consecutive weeks of overhead resistance in a single trading session. Market analyst Bitcoin Professor highlighted the 18% weekly performance and identified the $710–$725 zone as the decisive resistance area. According to his assessment, a confirmed breach above $725 could trigger accelerated upward momentum, though support between $690–$695 must remain intact to preserve the bullish framework.
Trading analyst Rand Group shared on X that sustained consolidation above the $670 level on monthly charts would represent an “extremely bullish” development for BNB. This observation arrived as the asset pushed through and maintained position above that threshold—a technical development the analyst had previously identified as a potential catalyst for extended gains.

Momentum Indicators Flash Warning Signs at Resistance
The daily Relative Strength Index for BNB has advanced into the upper 70s, with certain data sources reporting readings exceeding 80. Additional momentum oscillators including Stochastic indicators, the Commodity Channel Index, and Williams %R are all displaying extended conditions. The MACD histogram continues showing positive values, indicating the underlying momentum trend remains constructive.
While elevated RSI readings don’t necessarily predict an immediate reversal, they do indicate that a period of sideways consolidation becomes more probable should buying pressure fail to overcome the $725 barrier.
Wave Theory Points Toward $1,190 Objective
Technical strategist @finsends suggests BNB may have finished an A-wave decline within a broader corrective pattern. This analyst’s framework anticipates a 20–70% advance before the next corrective phase emerges, positioning a potential Wave B recovery target range between $780 and $1,190.
Breaking decisively above $1,400 would deliver more robust evidence of a higher-degree Wave 3 impulse developing, based on this same Elliott Wave interpretation. Several market watchers have marked $984 as a realistic objective for December.
BNB is currently trading comfortably above all major moving averages including the 20-, 50-, 100-, and 200-day lines. The 50-day simple moving average is positioned around $603, while the 200-day sits near $617—both considerably beneath current price action.
The critical price zones to monitor going forward are $725 as the immediate upside target and $690–$695 as the closest support level should profit-taking emerge.
Get 3 Free Stock Ebooks
Discover top-performing stocks in AI, Crypto, and Technology with expert analysis.
- Top 10 AI Stocks - Leading AI companies
- Top 10 Crypto Stocks - Blockchain leaders
- Top 10 Tech Stocks - Tech giants



