



Key Takeaways
- Bitcoin has remained trapped within a $62,000–$66,000 corridor for several weeks, as spot ETF demand is neutralized by miner and corporate liquidations
- Michael Saylor’s Strategy has liquidated 6,916 BTC totaling more than $440 million since June, departing from his historical buy-and-hold philosophy
- The upcoming U.S. Consumer Price Index release on Wednesday is viewed as the primary potential trigger for directional movement
- Cryptocurrency market volumes have plummeted to three-year lows
- A bullish weekly RSI signal continues to flash, though the critical $60,000 support threshold remains pivotal
Throughout the summer months, Bitcoin has exhibited minimal volatility, confined to a narrow trading channel between $62,000 and $66,000. Tuesday’s session mirrored this pattern, with BTC declining to approximately $63,500—a 0.6% decrease over 24 hours—perpetuating a standstill that has persisted for five consecutive weeks.
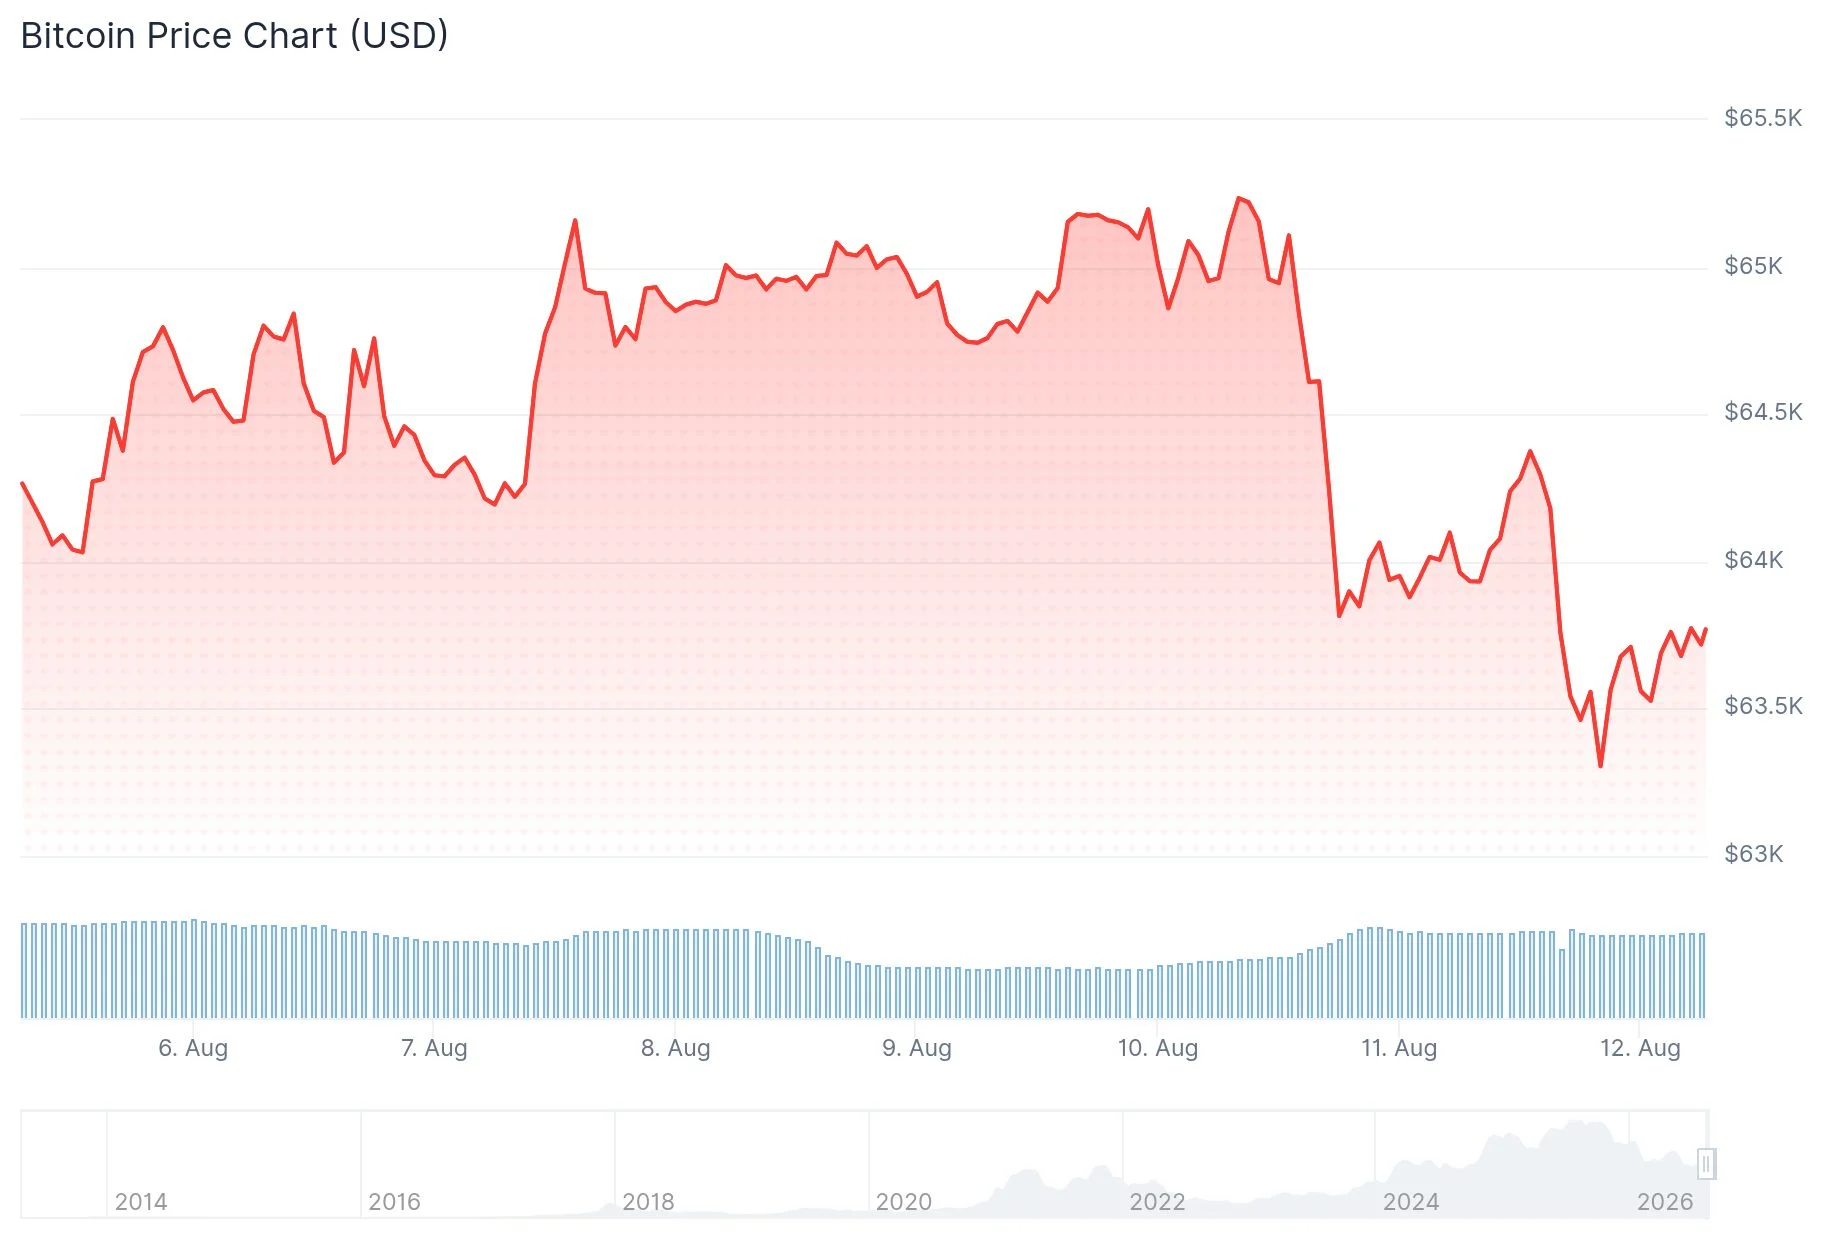
Market participation has contracted dramatically, with cryptocurrency exchange volumes retreating to their weakest levels witnessed in three years. This liquidity drought has left the market without sufficient momentum to establish a decisive directional bias.
“The current Bitcoin price behavior primarily reflects persistent spot ETF accumulation being counterbalanced by over-the-counter distribution from mining operations and Strategy,” explained Paul Howard, senior director at Wincent, a trading firm.
While institutional ETF purchases have maintained consistency, their impact has been systematically neutralized. Analysts at Bitfinex highlighted that corporate treasury liquidations have generated equivalent selling pressure, explaining why BTC managed only a modest 2% gain last week despite robust ETF capital inflows.

Strategy’s Distribution Activity Challenges Previous Narrative
In a departure from his long-standing commitment to permanent Bitcoin accumulation, Michael Saylor’s Strategy has distributed 6,916 BTC—exceeding $440 million in value—across four separate transactions since June. Two of these sales were executed to establish a USD liquidity reserve, while the remaining two funded MSTR stock repurchase programs.
This strategic pivot represents a notable deviation from Saylor’s previously uncompromising accumulation doctrine. While large wallet holders have absorbed approximately 30,000 BTC throughout August, Strategy’s distribution activity has contributed measurably to prevailing downside pressure.

The recent Coldcard wallet security breach introduced additional market uncertainty. Conservative estimates place the compromised holdings between 1,400 and 1,700 BTC, representing more than $100 million in losses.
Market attention has now pivoted entirely toward Wednesday’s U.S. Consumer Price Index announcement. This represents the first significant inflation measurement since Federal Reserve Chair Kevin Warsh delivered inflation-centric commentary following the July Federal Open Market Committee meeting.
“Directional conviction remains absent across market participants as seasonal summer liquidity constraints dominate price action,” noted Jeff Anderson, managing partner at STS Digital.
Technical Analysis Perspective
From a technical standpoint, the weekly timeframe displays a buy signal that activated when the Relative Strength Index touched the 30 threshold—this indicator continues to remain valid. Historically, this particular signal has successfully identified bear market terminations in two of the three previous occurrences.
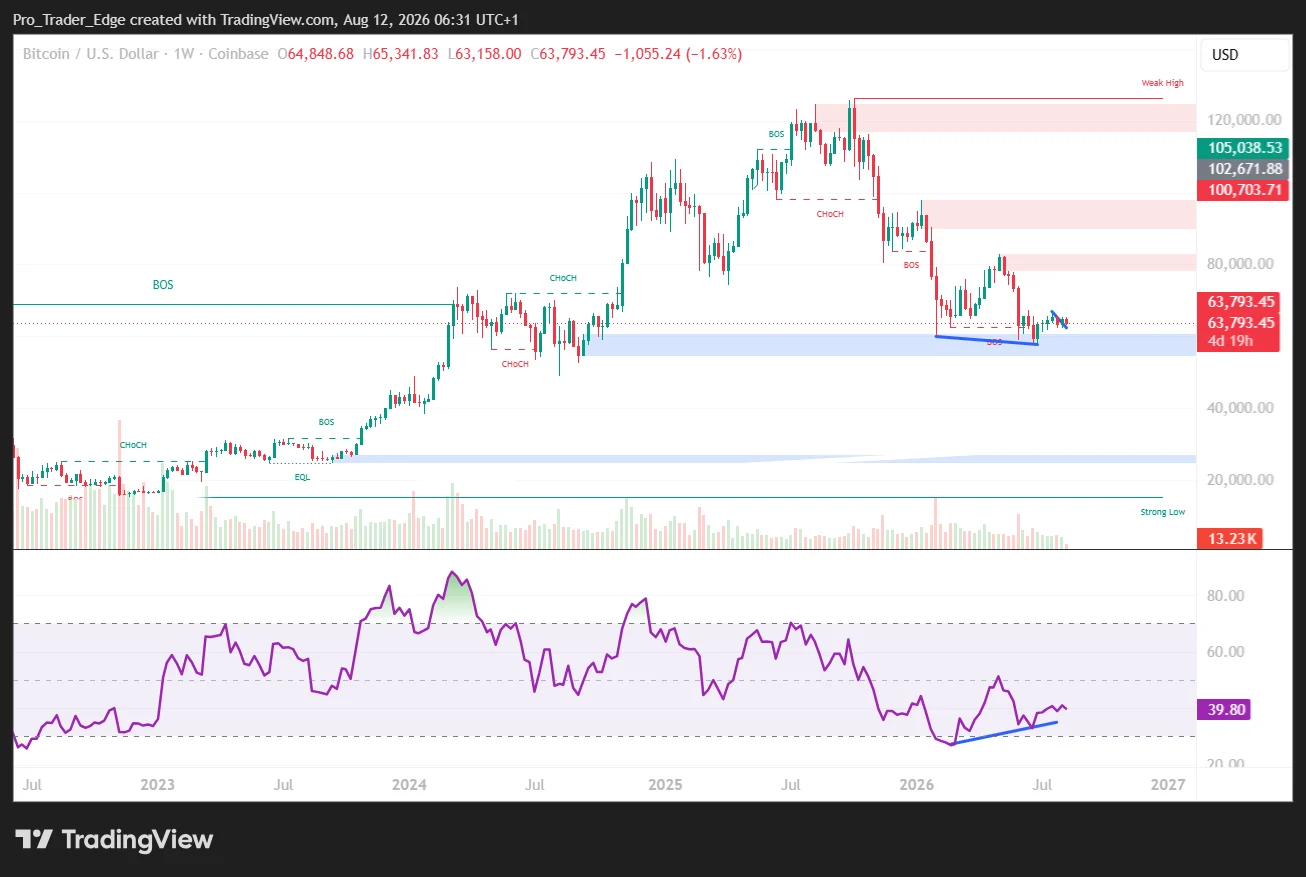
Nevertheless, the $60,000 price level represents the critical support zone requiring monitoring. A confirmed breakdown beneath this threshold would significantly undermine the bullish case for this technical pattern repeating its historical performance.
Market analyst Ted Pillows highlighted on X that Bitcoin experienced a 10.75% surge during the week following June’s CPI announcement and gained 7.58% after July’s release. With another inflation report scheduled for Wednesday, he posed the question: “What’ll happen this time?”
Historical performance data from CoinGlass indicates that September has consistently ranked as Bitcoin’s most challenging calendar month, recording an average decline of 4% dating back to 2013.
Get 3 Free Stock Ebooks
Discover top-performing stocks in AI, Crypto, and Technology with expert analysis.
- Top 10 AI Stocks - Leading AI companies
- Top 10 Crypto Stocks - Blockchain leaders
- Top 10 Tech Stocks - Tech giants



