



Key Highlights
- DASH surged 17.5% to reach $56.85, marking its strongest price level since May amid a privacy coin market rally
- Grayscale’s Zcash ETF surpassed $400M in total assets following its NYSE Arca debut on August 25
- The privacy-focused cryptocurrency has gained approximately 85% from its mid-August bottom around $30
- Technical indicators show a golden cross formation with the 50-day EMA crossing above the 200-day EMA
- Maintaining support at $52 could enable a rally toward $72; breaking below risks correction to $40
On September 4, DASH began trading at $47.46 and surged to an intraday peak of $56.85 before consolidating around $55.76. This price action represents the cryptocurrency’s strongest level in over four months and occurred during a widespread rally across privacy-oriented digital assets.
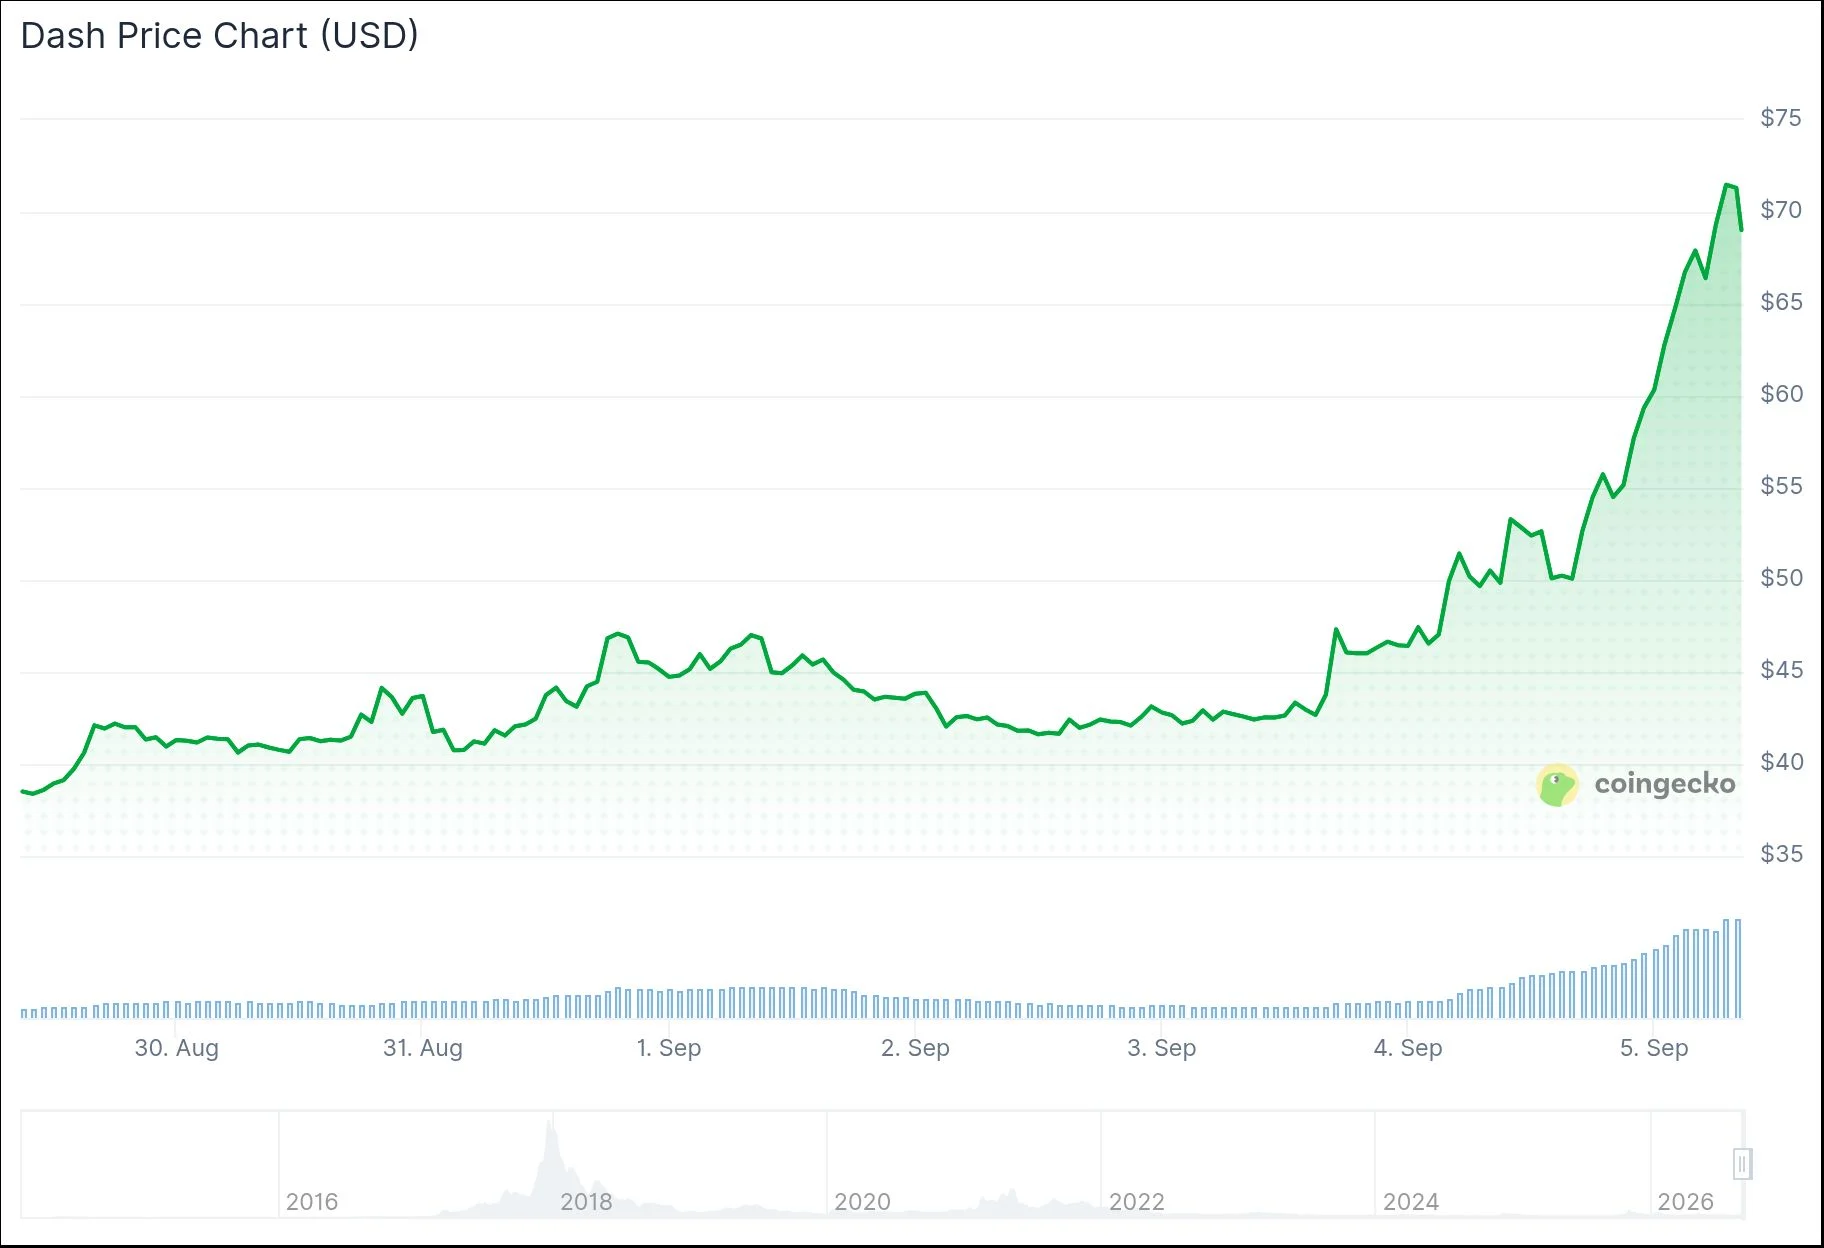
The primary driver behind this movement appears to be Grayscale’s Zcash exchange-traded fund. After its NYSE Arca launch on August 25 with approximately $300 million in assets under management, the fund has expanded to over $400 million. During this period, ZEC climbed above $1,000 and secured a position among the top ten cryptocurrencies by market capitalization.
Market participants frequently categorize Zcash and Dash within the same category due to their privacy features and payment functionality. As ZEC attracted investor attention, capital began flowing into DASH as an alternative investment opportunity. The Dash development team has not released any significant project updates that would independently account for this price movement.
Bullish Technical Indicators Emerge
DASH’s chart displays a golden cross pattern, where the 50-day exponential moving average has crossed above the 200-day exponential moving average. This configuration typically signals positive momentum for an asset.
The MACD indicator continues trading above the zero threshold, while the Awesome Oscillator histogram shows sustained strength. Additionally, the Chaikin Money Flow indicator remains positive, suggesting ongoing accumulation and buying interest.

The Relative Strength Index currently reads 75.91, placing it in overbought territory. This elevated reading suggests the possibility of near-term consolidation or minor pullback before continuation.
On-chain data reveals increasing daily transaction volume on the Dash blockchain, indicating that network utility is expanding alongside speculative trading interest.
Critical Support and Resistance Zones
The $55 to $57 range represents the immediate resistance area. DASH previously tested this zone twice during May but was unable to sustain those levels. A decisive break above $57 would establish $60 as the next logical target.
Should downward pressure emerge, $48 serves as the initial support level. More substantial retracement could push prices toward the $43–$44 area.
Cryptocurrency market analyst Crypto Patel shared on X that DASH reached $54.60, representing an 86% increase from their identified accumulation range. The analyst maintains a positive long-term outlook, highlighting potential price objectives at $100, $200, $300, $400, and $500, while emphasizing that maintaining support above $30 is essential for preserving the bullish market structure.
The $52 price point is viewed as the crucial short-term support level. Holding above this threshold maintains the possibility of reaching $72. Failure to defend it could interrupt the current upward momentum.
As of September 4, DASH was trading around $55.76, representing an approximately 85% appreciation from its mid-August price level near $30.
Get 3 Free Stock Ebooks
Discover top-performing stocks in AI, Crypto, and Technology with expert analysis.
- Top 10 AI Stocks - Leading AI companies
- Top 10 Crypto Stocks - Blockchain leaders
- Top 10 Tech Stocks - Tech giants



