



Key Highlights
- HYPE token has declined approximately 24% during the last 30 days, currently hovering around $54.06.
- Institutional players Multicoin Capital and Bitwise moved roughly $8.74 million worth of HYPE to Coinbase.
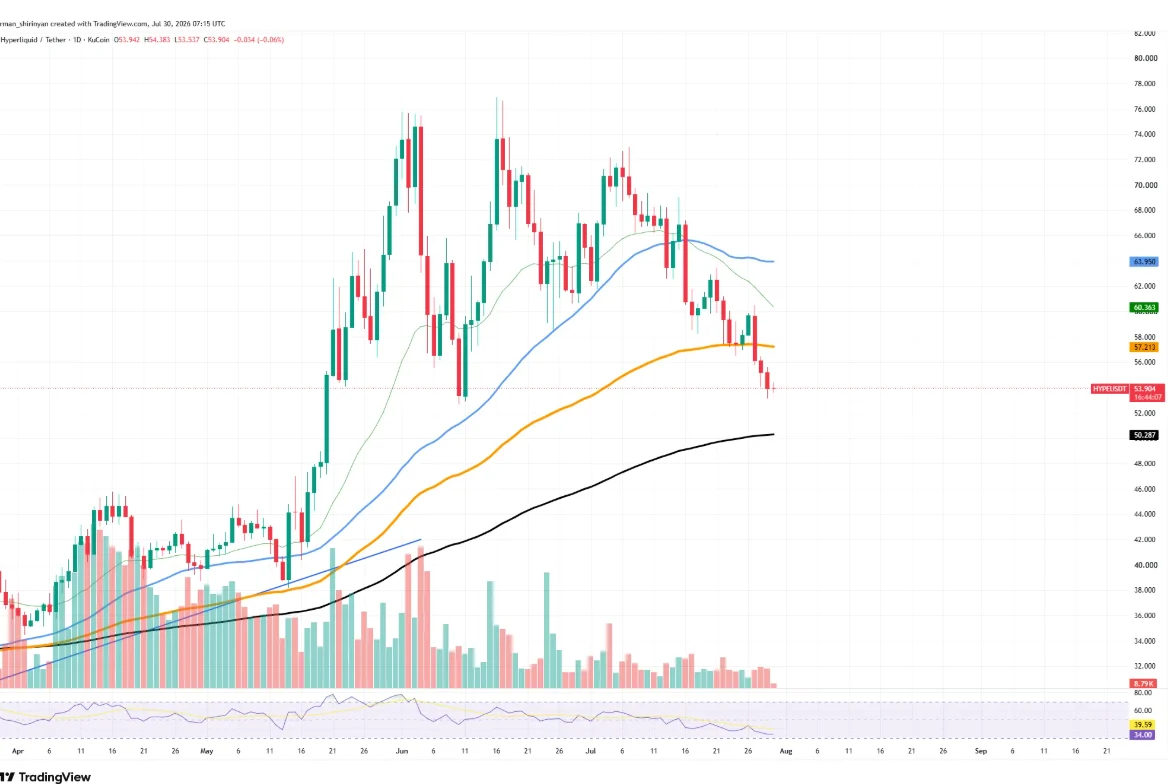
- Price action continues trading beneath both 50-day and 100-day moving averages.
- Relative strength index sits around 34, indicating the asset approaches oversold conditions.
- Primary support zone established between $53.50 and $54, with secondary support at $52.
The Hyperliquid native token has extended its downward trajectory throughout the month as institutional holders maintained steady transfers to centralized trading platforms. HYPE price has registered approximately 24% losses across the past 30 days, with current trading activity centered around $54.06 based on four-hour chart analysis. This downturn emerged after multiple unsuccessful attempts to sustain momentum above the $60 threshold during July, coinciding with broader cryptocurrency market uncertainty.
Blockchain analytics revealed that Multicoin Capital executed a transfer of 137,100 HYPE tokens to Coinbase Prime, representing approximately $7.51 million in value. Separately, Bitwise moved 22,463 HYPE tokens worth nearly $1.23 million to the same exchange. While exchange deposits alone cannot definitively signal selling intent, such movements typically expand circulating supply on platforms and may diminish buyer sentiment during periods of subdued demand. Comparable institutional transfers throughout July have consistently dampened short-term rally attempts.
Moving Averages Signal Continued Weakness
The HYPE token continues trading beneath critical technical benchmarks after surrendering a significant support level. Current price action positions the asset closer to its 200-day moving average, situated near the $50 mark, representing the subsequent major long-term support threshold. This ascending average could attract value-focused buyers, though sellers maintain dominance over the broader trend structure.
Source: TradingView

The relative strength index has descended to approximately 34, positioning HYPE near oversold territory for the first time in recent weeks. While this metric can facilitate short-term bounce scenarios, it does not guarantee a definitive market floor. Persistent exchange inflows could hamper recovery efforts should institutional holders continue reducing positions. Sustained buying volume remains essential before any meaningful reversal can establish itself.
Critical $50 Level Attracts Market Attention
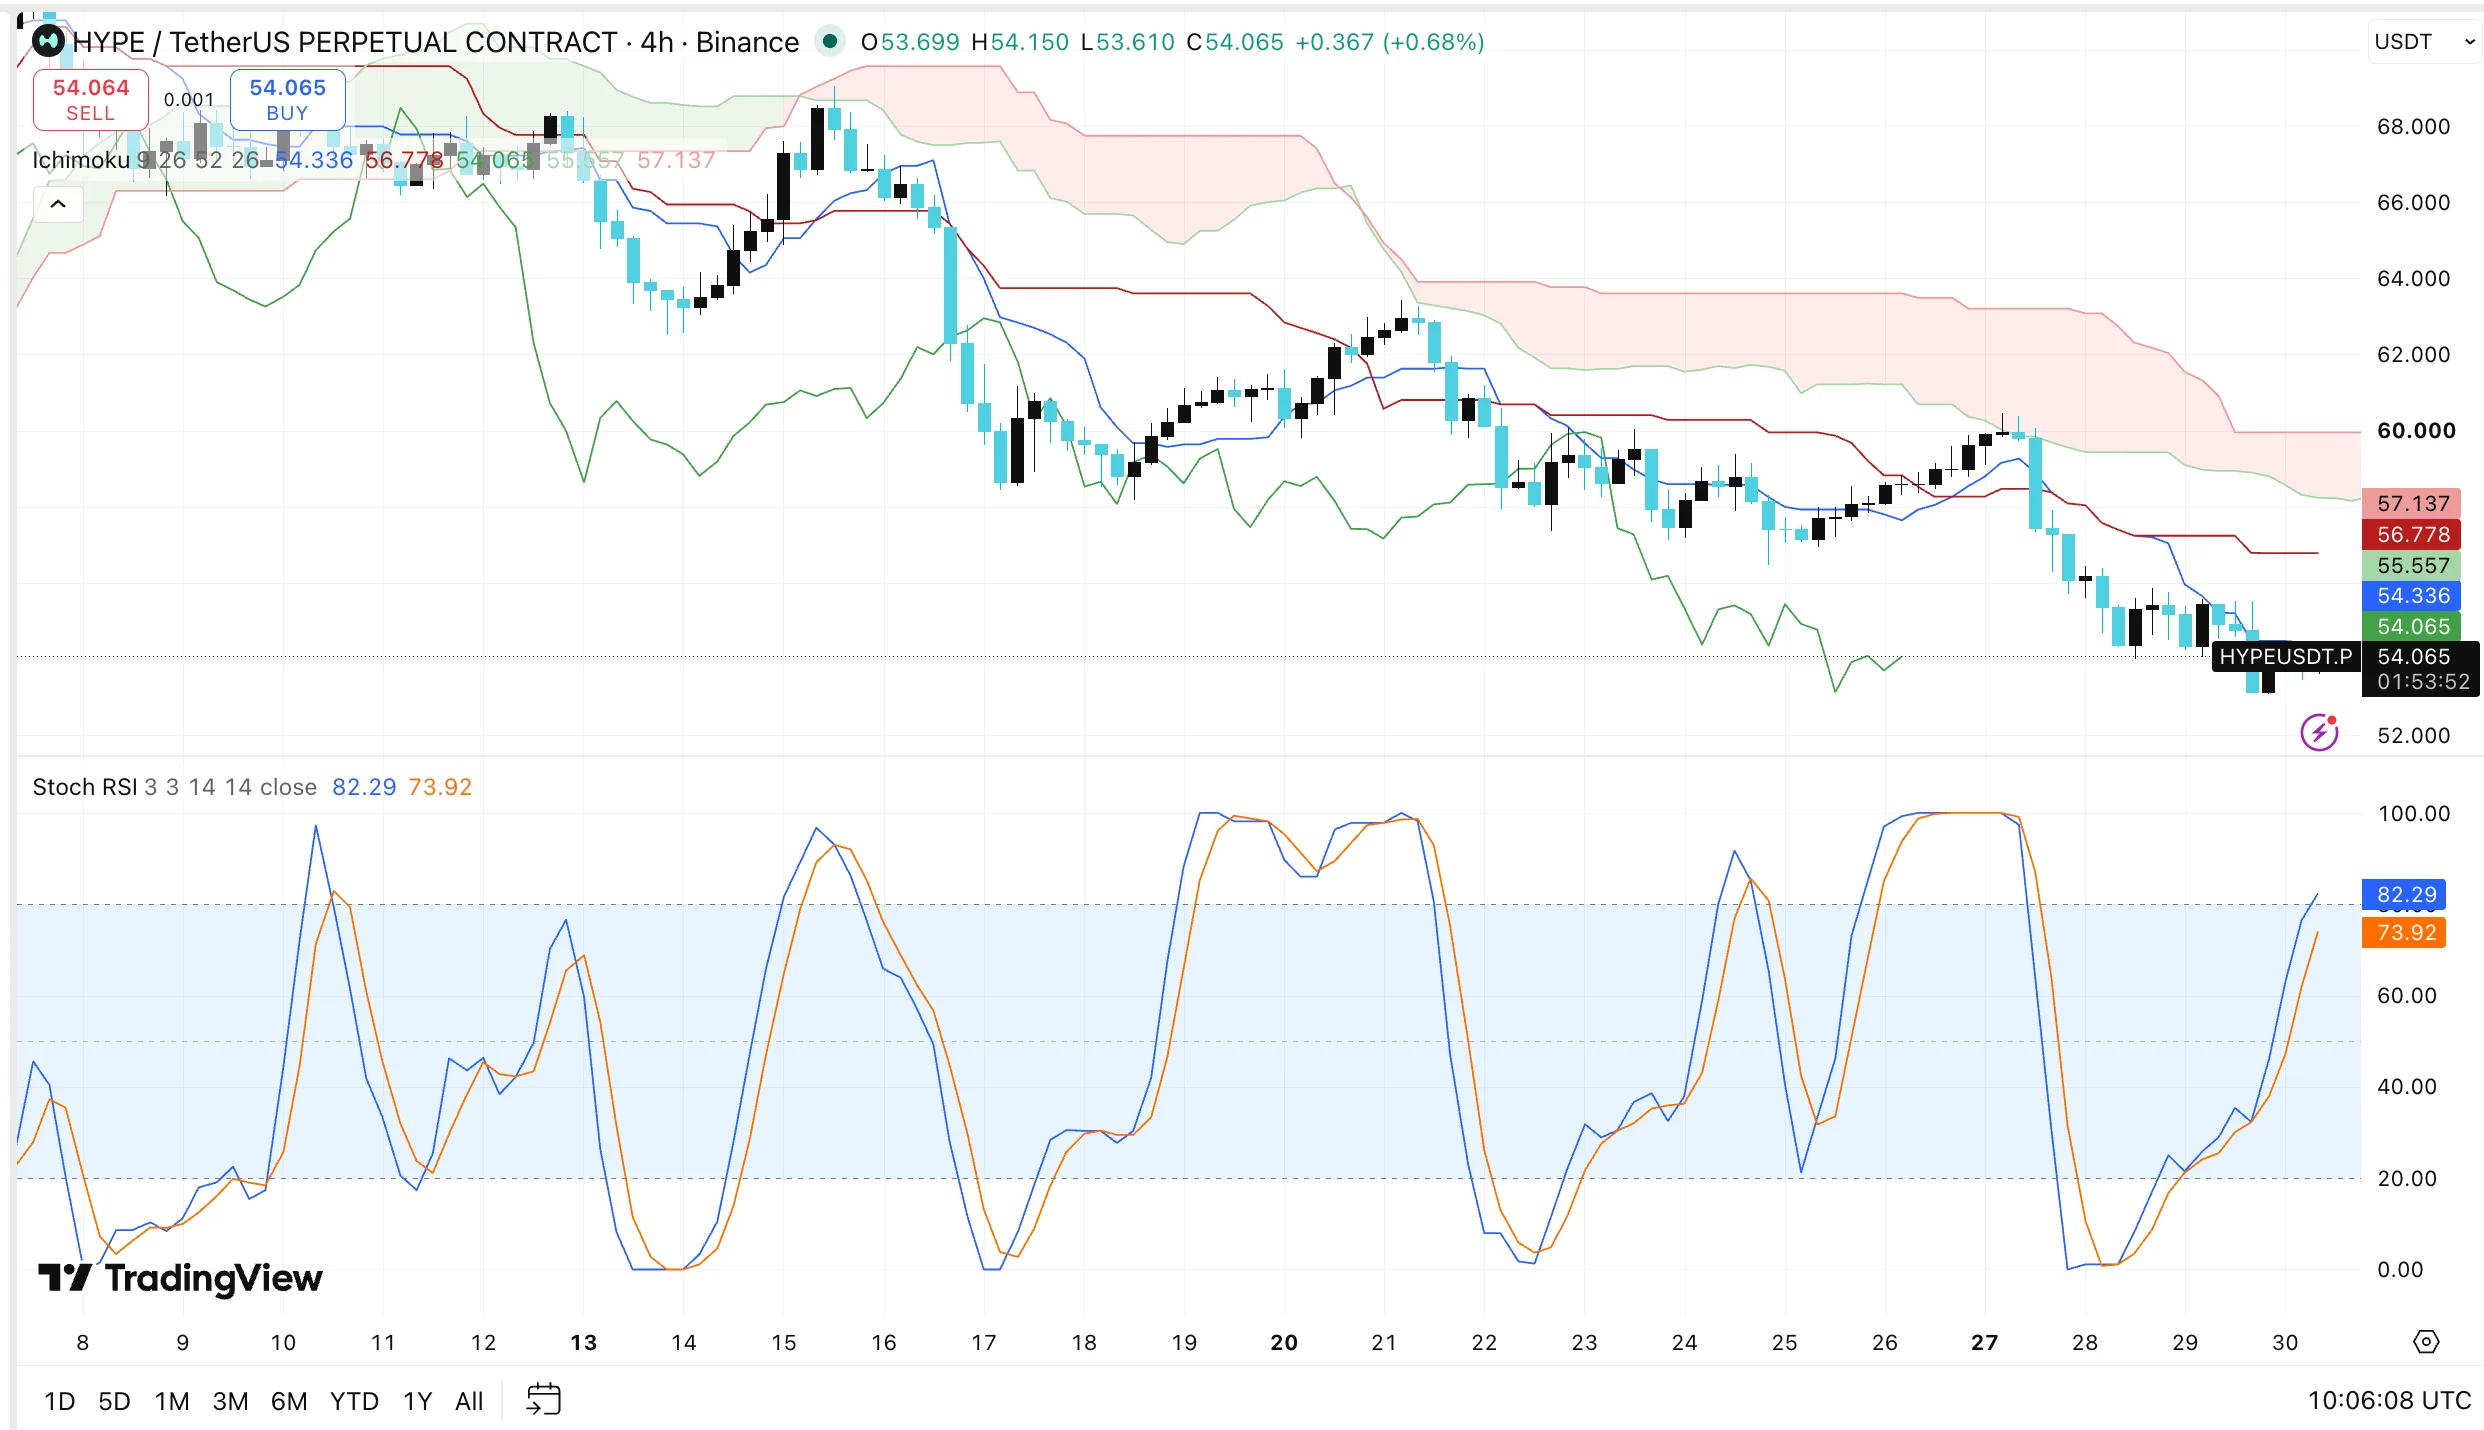
Four-hour chart analysis shows HYPE maintaining position below the Ichimoku cloud formation, confirming that selling pressure dominates near-term price action. The token trades beneath multiple Ichimoku resistance levels positioned at $54.34, $55.56, $56.78, and $57.14. These levels represent potential obstacles during any upward correction attempts. The cloud structure serves as the primary challenge for bullish participants.
Initial support establishes itself within the $53.50 to $54 range. A decisive breakdown below this zone could trigger movement toward $52. Additional selling pressure would subsequently bring the $50 region into immediate focus. Maintaining current support levels might enable buyers to challenge $54.34 before pursuing higher resistance targets. Breaking below $53.50 could accelerate downward momentum.
The Stochastic RSI has advanced to 82.29, with its signal line reaching 73.92. This upward movement indicates improved near-term momentum, though the indicator has entered overbought territory. HYPE may experience a temporary bounce, yet traders could secure profits unless price action crosses above $55.56 and sustains that threshold. Advancing beyond $56.78 would enhance the short-term technical outlook.
Source: TradingView
Trading volume has diminished compared to the elevated activity observed during May and June. Reduced volume during declining price action frequently indicates weakening buyer participation. The $50 to $52 range has emerged as the critical zone for market participants to monitor. Breaking above the cloud formation near $57.14 would demonstrate improved buyer strength and potential trend reversal.
Get 3 Free Stock Ebooks
Discover top-performing stocks in AI, Crypto, and Technology with expert analysis.
- Top 10 AI Stocks - Leading AI companies
- Top 10 Crypto Stocks - Blockchain leaders
- Top 10 Tech Stocks - Tech giants



