

Key Takeaways
- XRP is currently fluctuating between $1.43 and $1.45, showing a 1.2% gain over the past day
- Critical resistance levels are positioned at $1.44–$1.50, while support remains firm around $1.35
- Technical analysts have identified a developing Gartley harmonic formation with a potential upside target of $2.64
- A symmetrical triangle pattern is compressing on daily timeframes, suggesting an imminent directional move
- Crypto analyst EGRAG CRYPTO identifies an initial breakout objective of $2.30 following a clear break of macro resistance
XRP continues to trade within a confined price range as multiple technical formations align, prompting heightened attention from market analysts anticipating a decisive move.
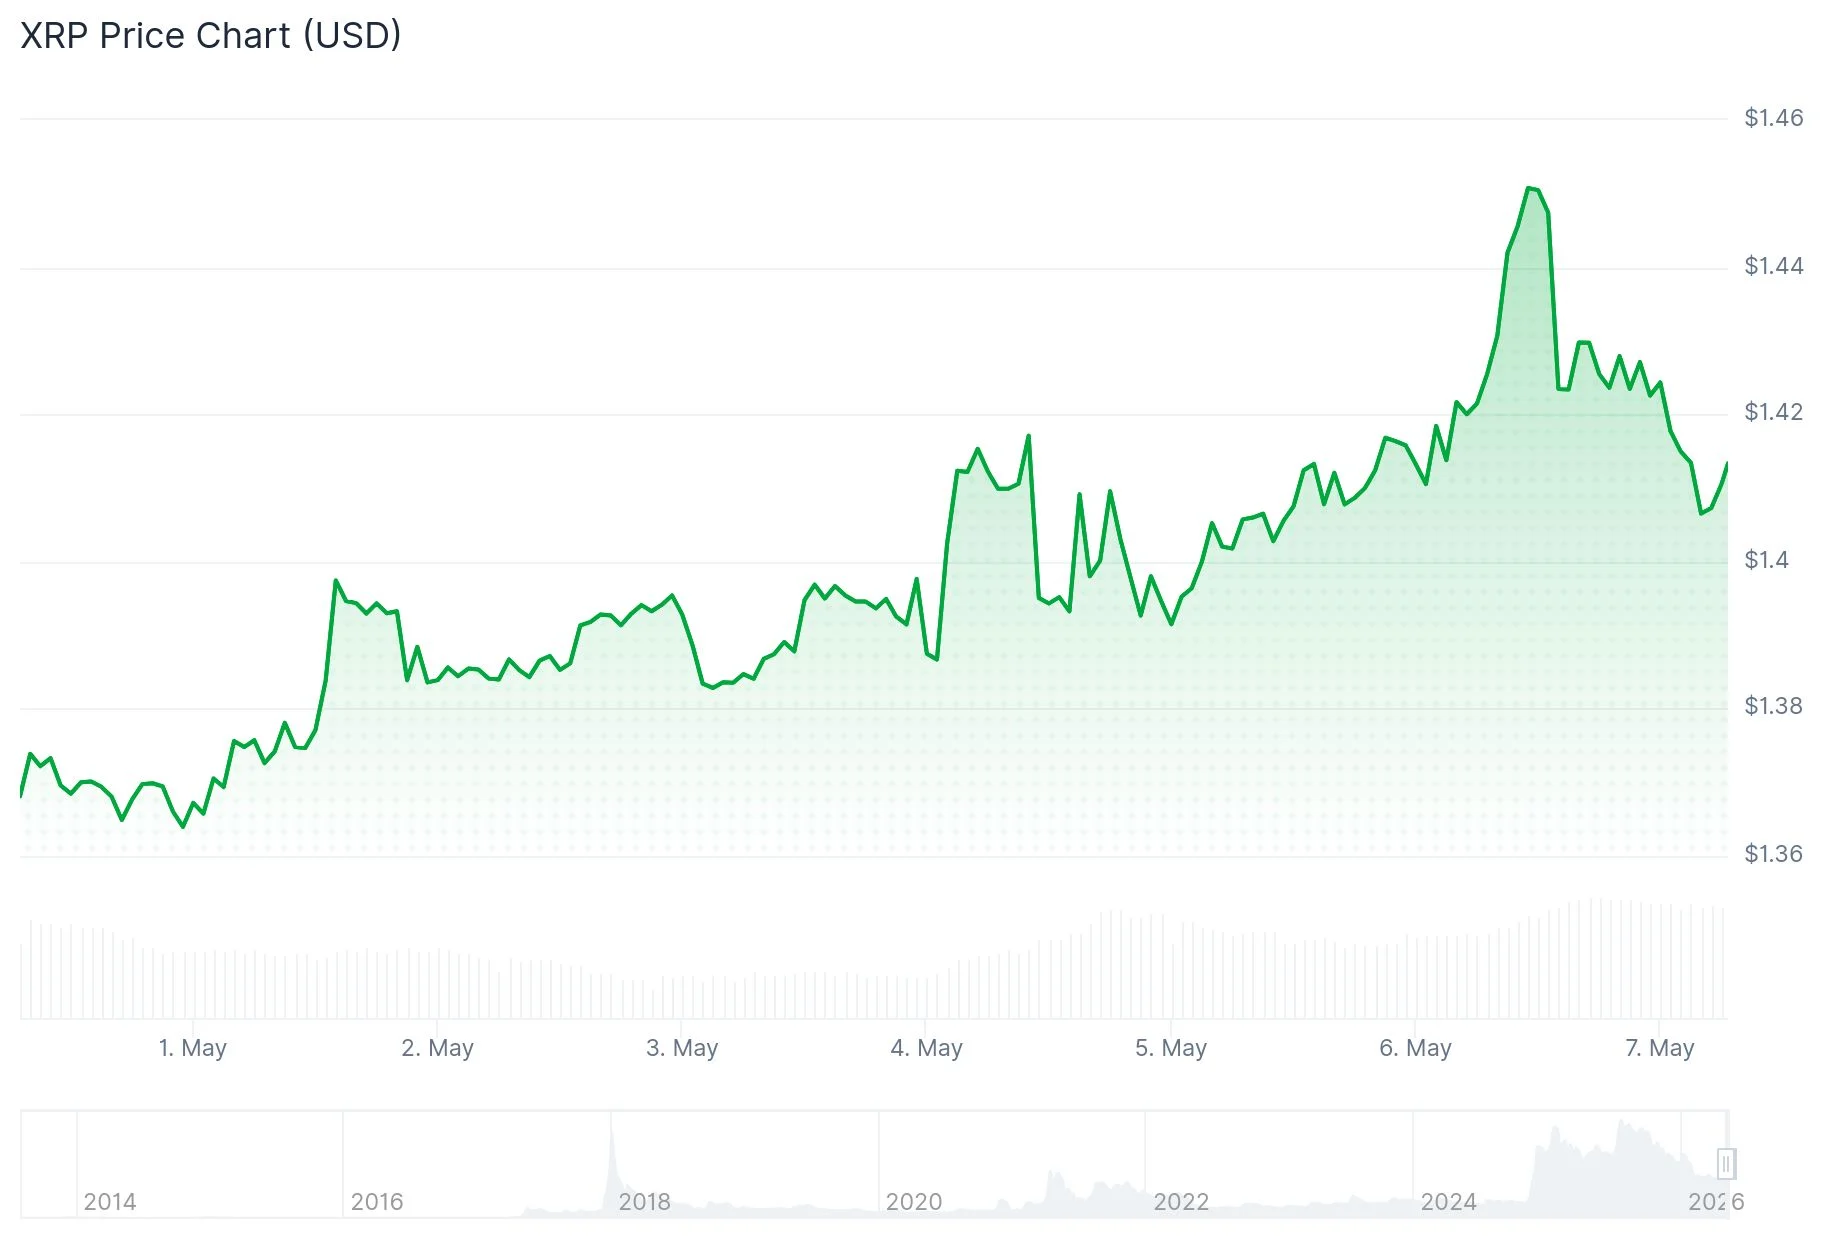
The digital asset, renowned for facilitating rapid and cost-effective cross-border transactions, is presently fluctuating in the $1.43 to $1.45 corridor. While the last 24-hour period delivered a moderate 1.2% uptick, the more compelling narrative lies in the technical structures developing on the charts.
Price action has been maintaining position above the middle Bollinger Band on daily charts. This technical level has functioned as fluid support, allowing bullish momentum to persist. The upper Bollinger Band ranging from $1.46 to $1.47 represents the next significant barrier that must be overcome.
MACD indicators are exhibiting gradual strengthening. Although a definitive breakout confirmation remains pending, preliminary signals of a bullish convergence are emerging. Current trading volume sits at moderate levels, which market technicians often interpret as accumulation behavior rather than selling pressure.
Harmonic Formation Points to Substantial Upside
Technical analyst The_Alchemist_Trader_ has highlighted a Gartley harmonic configuration forming on XRP’s price chart. This pattern is approaching its concluding C-D segment, and upon successful completion, it suggests a potential price objective in the vicinity of $2.64. The analyst emphasized: “The harmonic framework is entering its terminal stage, making the preservation of current support levels essential for pattern validation.” Should price action fall beneath existing support, this technical scenario would be negated.

In a separate analysis, EGRAG CRYPTO drew attention to a contracting symmetrical triangle visible on the daily timeframe. Such formations characteristically precede substantial volatility and directional movement. EGRAG CRYPTO highlighted that this configuration “has the potential to generate a powerful breakout after clearing key macro resistance barriers,” with a preliminary upside target near $2.30. However, the possibility of a false breakout—where price temporarily spikes before reversing—remains a consideration.
Critical Price Zones Under Surveillance
The $1.44–$1.50 territory has functioned as a persistent distribution area. A decisive daily close surpassing this region would establish a pathway first toward $1.60, followed by potentially higher objectives. Conversely, $1.35 represents the essential support threshold. A breakdown through this level could drive price action toward $1.32.
The Relative Strength Index currently registers at 57—positioned in neutral territory, avoiding both overbought and oversold extremes. Short-term moving averages exhibit bullish alignment, whereas broader oscillators maintain neutral positioning. The daily chart displays a “Change of Character” formation, which indicates a possible trend transformation without yet establishing directional commitment.
From a fundamental perspective, Ripple has been releasing announcements regarding expanded participation in asset tokenization initiatives and institutional adoption of the XRP Ledger for cross-border settlement applications. While these developments bolster longer-term market confidence, their capacity to catalyze immediate price action remains limited.
As of current market conditions, XRP is exchanging hands at approximately $1.45, positioned marginally beneath the crucial $1.46–$1.47 resistance boundary.
Get 3 Free Stock Ebooks
Discover top-performing stocks in AI, Crypto, and Technology with expert analysis.
- Top 10 AI Stocks - Leading AI companies
- Top 10 Crypto Stocks - Blockchain leaders
- Top 10 Tech Stocks - Tech giants


