

Key Takeaways
- XRP maintains a trading price of $1.42 with market capitalization at $87.93 billion and daily trading volume of $1.09 billion
- Current price action shows consolidation around 20-day and 50-day exponential moving averages in a compression formation
- Relative Strength Index hovers between 54–55, indicating neutral momentum with slight bullish bias
- Breaking resistance at $1.45–$1.50 could trigger upward movement toward the $3.00 level
- Falling below the $1.10 support zone may drive prices down to $0.90
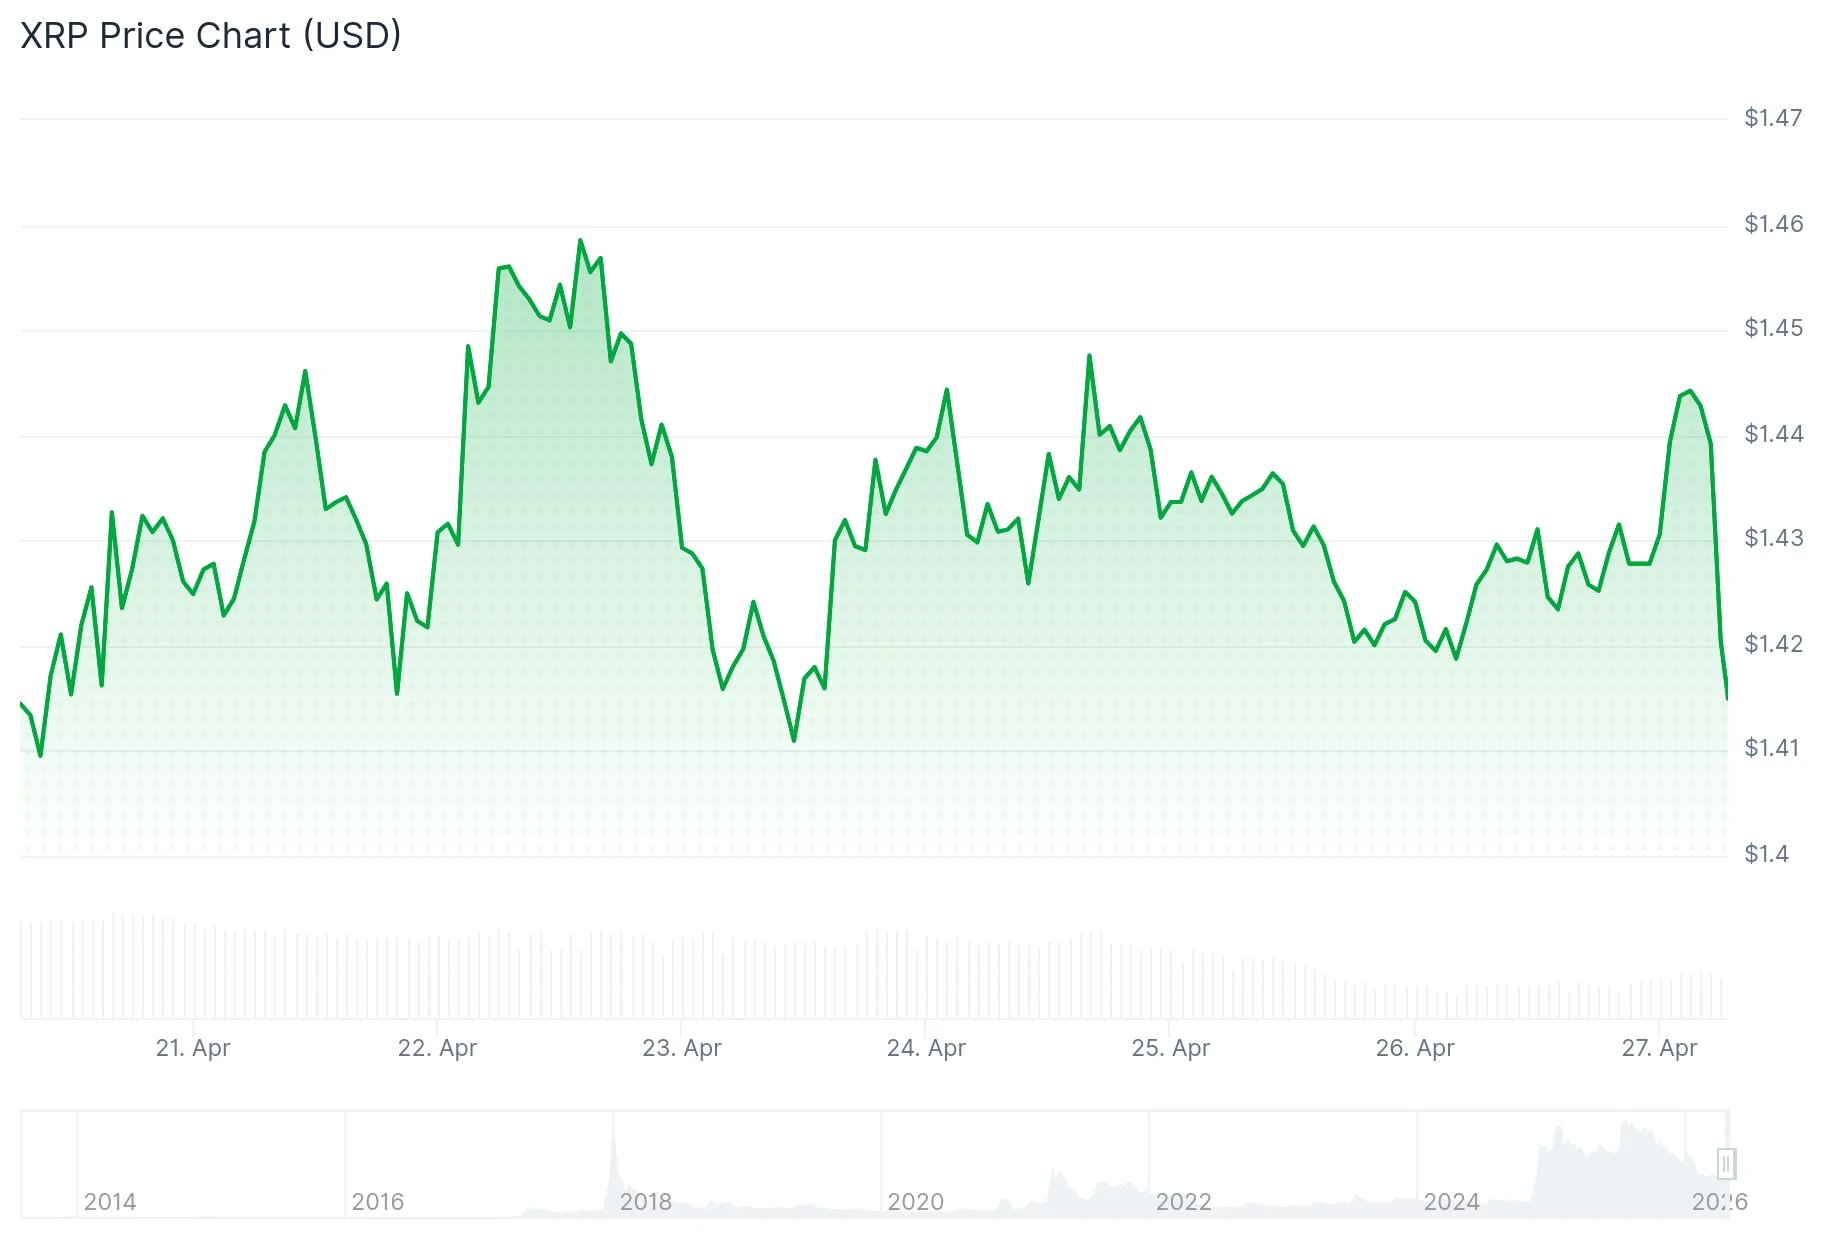
XRP continues to hold at the $1.42 price level, displaying minimal volatility throughout the past seven days. Trading volume registered at $1.09 billion over the previous 24-hour period, representing approximately a 4% decline.
With a market capitalization holding firm at $87.93 billion, the asset demonstrates stability. This suggests the market is in a consolidation phase rather than experiencing significant buying or selling activity.
Crypto analyst EGRAG CRYPTO observed that market participants are transitioning from traditional candlestick analysis to line chart examination. This approach eliminates short-term volatility noise and provides clearer insight into broader trend development.
EGRAG CRYPTO’s analysis highlights that XRP displays a compression pattern characterized by descending highs converging into an established support area. Such technical formations frequently indicate accumulation phases preceding significant price movements.
The 50-period exponential moving average currently provides support on monthly timeframes. EGRAG CRYPTO also mentioned the potential for a brief downward wick toward the 100 EMA before any significant expansion phase materializes.

Near-Term Chart Analysis
Examining the hourly timeframe, XRP recently tested $1.4471 before experiencing a minor retracement. The asset remains positioned above its 100-hour Simple Moving Average and a bullish trendline offering support around $1.4320.
Multiple short-duration exponential moving averages — including the 10, 20, 30, and 50-period intervals — are positioned beneath current price action and generating buy signals. This configuration indicates that dips are attracting buying interest.
The primary resistance barrier exists at $1.45. Successfully clearing this threshold could facilitate advances toward $1.4650, followed by $1.4840, and potentially $1.50. The subsequent major obstacle lies at $1.5150.
Regarding downside risk, immediate support appears at $1.44, with additional backing at $1.4320. Should the price close beneath $1.4320, further support zones at $1.4050 and $1.40 would come into focus.
Indicator Analysis and Key Levels
The Relative Strength Index currently reads near 54–55, positioned above the neutral threshold after recovering from oversold conditions observed in February. The MACD indicator has generated a modest buy signal, though analysts note it lacks sufficient strength to validate an imminent breakout.
Additional momentum indicators such as the stochastic RSI and commodity channel index remain clustered in neutral territory. This balanced indicator landscape suggests the market awaits a catalyst.
The primary pivot point is positioned near $1.41. Overhead resistance levels are identified at $1.51, with extended targets at $1.72 and $2.04. Support structures below include $1.22, with deeper zones at $1.10 and $0.90.
XRP presently trades just above the $1.41–$1.43 pivot range, which technical analysts identify as the critical zone that will determine the next significant price direction.
Get 3 Free Stock Ebooks
Discover top-performing stocks in AI, Crypto, and Technology with expert analysis.
- Top 10 AI Stocks - Leading AI companies
- Top 10 Crypto Stocks - Blockchain leaders
- Top 10 Tech Stocks - Tech giants


