
 Approaches Critical Resistance Zone Amid Economic Headwinds")
Quick Summary
- The S&P 500 maintains its upward trajectory but faces critical channel resistance between 7,100 and 7,250
- Economic expansion decelerated sharply to 0.5% annualized in Q4 2025, a dramatic decline from Q3’s 4.4% rate
- Consumer price inflation accelerated to 3.3% in March, complicating the Federal Reserve’s rate policy outlook
- Corporate earnings are forecast to expand 18.6% in 2026, providing fundamental support for equity prices
- Breaking below the 6,400–6,500 range would signal the most significant bearish development
The S&P 500 continues to maintain its bullish structure, yet recent developments have introduced fresh complexity into the market equation. Price pressures are intensifying, economic momentum has decelerated, and the benchmark index now confronts a crucial resistance barrier.
Let’s examine the current landscape.
The benchmark is hovering near the upper boundary of its long-term ascending channel, specifically in the 7,100–7,250 zone. This technical ceiling has previously capped upward movements. While the market structure remains constructive, it has exited what would be considered a favorable risk-reward entry zone.
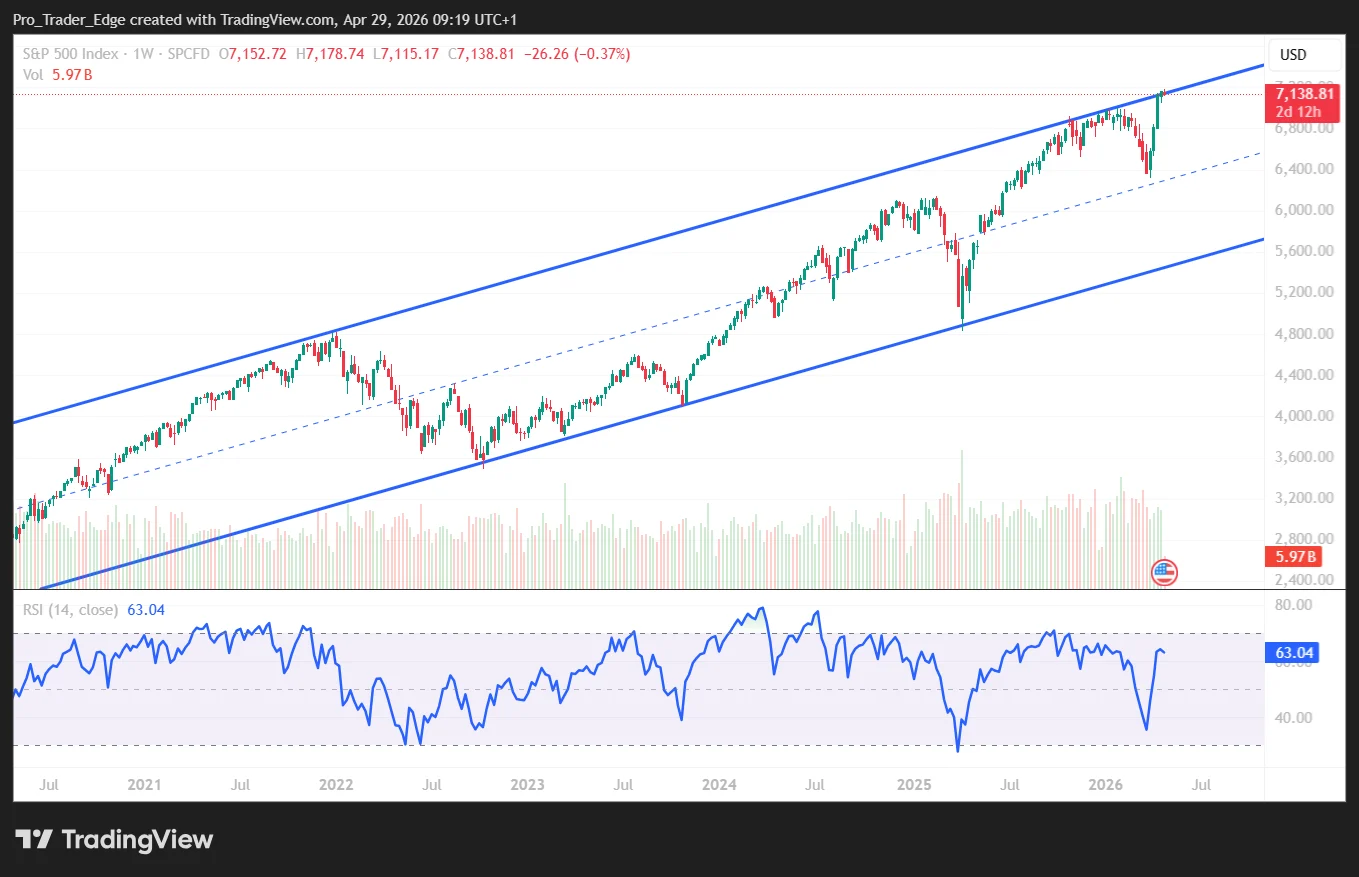
Near-term price support exists in the 6,800–6,900 vicinity. A retracement that finds stability at these levels would represent typical consolidation behavior. The more critical support zone lies at 6,400–6,500, marking the foundation of the latest upward leg.
According to Bureau of Economic Analysis figures, the United States economy expanded at just a 0.5% annualized pace during Q4 2025. This represents a substantial deceleration from the previous quarter’s 4.4% growth rate. While expansion continues, the forward velocity has clearly diminished.

Concurrently, inflation has resurged. The Consumer Price Index climbed 3.3% on a year-over-year basis in March, accelerating from February’s 2.4% reading. Core inflation registered at 2.6%. Energy commodities drove much of the increase, with gasoline prices surging 18.9% annually.
The Federal Reserve maintains its benchmark rate within the 3.50%–3.75% corridor. With price pressures reaccelerating, the rationale for rapid monetary easing has diminished considerably. Elevated interest rates continue to exert downward pressure on equity valuations, particularly affecting growth-oriented securities.
The Optimistic Scenario
The bullish argument centers on corporate profitability. FactSet data projects S&P 500 constituent earnings will expand 18.6% throughout 2026. Every sector within the index is currently delivering positive revenue growth on a year-over-year basis during the current reporting period.
Should corporate profits maintain their trajectory and inflation moderate following the energy-driven spike, the market possesses sufficient fundamental support for appreciation despite above-average valuation multiples.
A weekly settlement above the 7,200–7,250 threshold would constitute a constructive technical development. Subsequent upside objectives would target approximately 7,400, followed by 7,600.
The optimistic case also requires recession probability to remain low. Provided employment conditions stay healthy and credit markets remain stable, investors will likely continue absorbing selloffs.
The Pessimistic Scenario
The bearish perspective begins with valuation metrics. The S&P 500 currently trades at a forward price-to-earnings multiple of 20.9. This exceeds both the five-year average of 19.9 and the decade-long average of 18.9, per FactSet.
Elevated valuations don’t guarantee declines. However, they reduce margin for error should earnings falter or government bond yields continue climbing.
The index is also testing the upper boundary of its ascending channel formation. While not inherently bearish, this positioning doesn’t represent an optimal risk-reward entry opportunity.
An unsuccessful breakout attempt above 7,200–7,250 coupled with a reversal below 7,000 would represent an initial cautionary signal. A weekly close beneath 6,400–6,500 would carry more significant implications, suggesting the recent advance has exhausted itself.
The most probable catalysts for bearish price action include persistent inflation, rising Treasury yields, or disappointing earnings projections from index heavyweights.
Conclusion
The S&P 500’s upward trend remains technically valid. Corporate earnings growth is substantive, buyers have consistently supported pullbacks, and recession probability appears manageable rather than imminent.
The next critical data releases include forthcoming inflation reports and earnings guidance from major corporations reporting throughout this quarter.
Get 3 Free Stock Ebooks
Discover top-performing stocks in AI, Crypto, and Technology with expert analysis.
- Top 10 AI Stocks - Leading AI companies
- Top 10 Crypto Stocks - Blockchain leaders
- Top 10 Tech Stocks - Tech giants


