


TLDR
- Solana has triggered its first 3-day SuperTrend bullish signal since October 2025, indicating a possible momentum shift
- Over 1.6 million fresh Solana addresses were created in the last two weeks, according to analyst Ali Charts
- Top Binance traders maintain a Long/Short Ratio of 1.89, with 65.45% favoring long positions
- Breaking through $84 resistance is critical for SOL to reach $90, and eventually $100
- Weekly chart displays bullish RSI divergence, hinting the corrective wave may be concluding
Solana is displaying preliminary signals of a momentum reversal following a crucial technical indicator turning positive for the first time in nearly nine months. This development arrives after an extended downtrend that pushed SOL to approximately $60 during June.
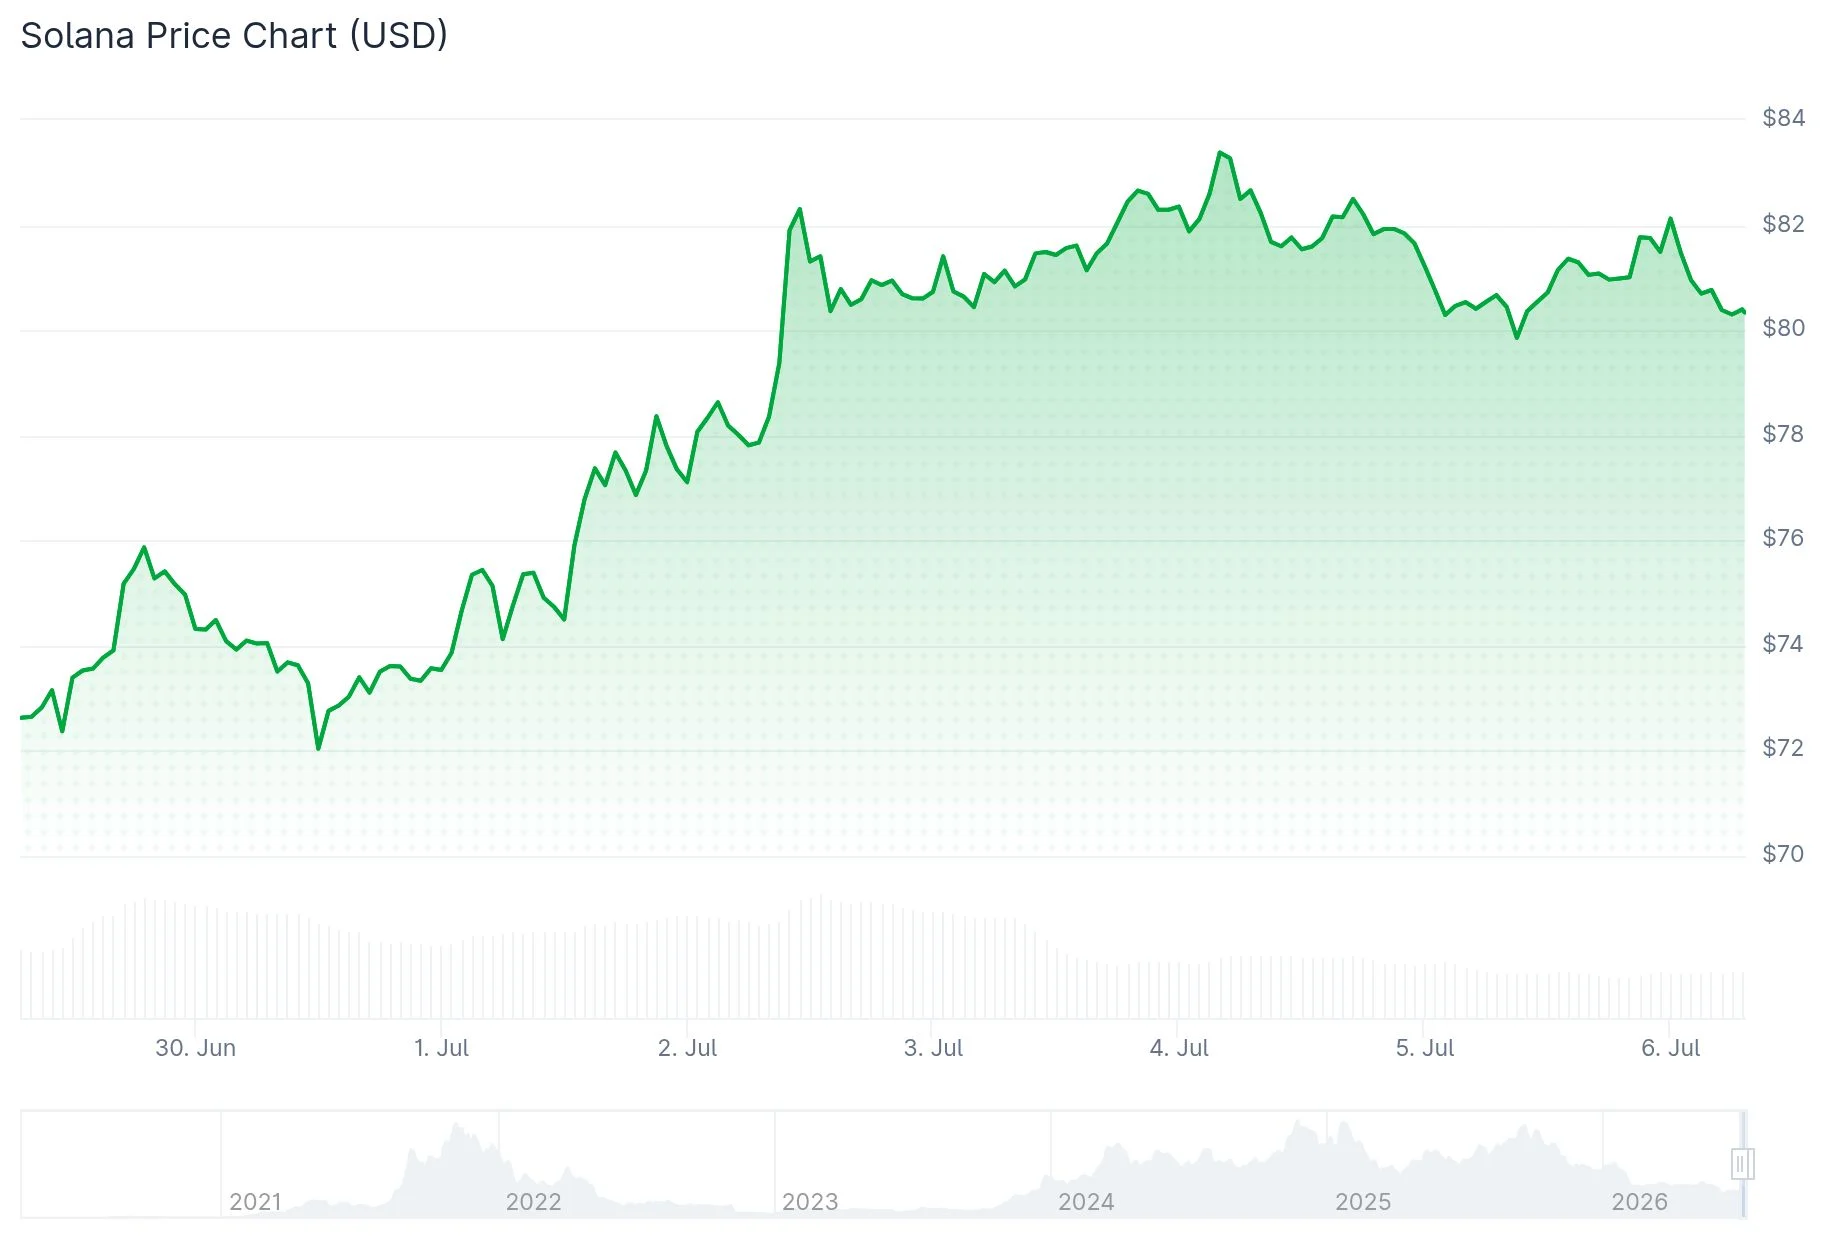
The 3-day SuperTrend indicator has issued a buy signal — marking the first occurrence since October 2025. The preceding sell signal coincided with a substantial 74% price decline, making this fresh signal particularly significant for market participants.
Analyst Ali Charts highlighted this development on X, emphasizing the SuperTrend’s flip beneath the price action as indication that accumulation momentum could be strengthening. The SuperTrend utilizes average true range calculations to identify trend direction, and when it positions below price, traders typically interpret this as a bullish development.
Ali Charts additionally revealed another notable metric: the Solana network has welcomed 1.6 million new addresses within the previous two-week period. Such network expansion typically signals increasing user engagement and heightened interest throughout the ecosystem.
Institutional Trader Sentiment
Binance’s elite traders are demonstrating strong bullish conviction. According to CoinGlass analytics, long accounts represent 65.45% of monitored positions, while short accounts constitute 34.55%. This configuration produces a Long/Short Ratio of 1.89.

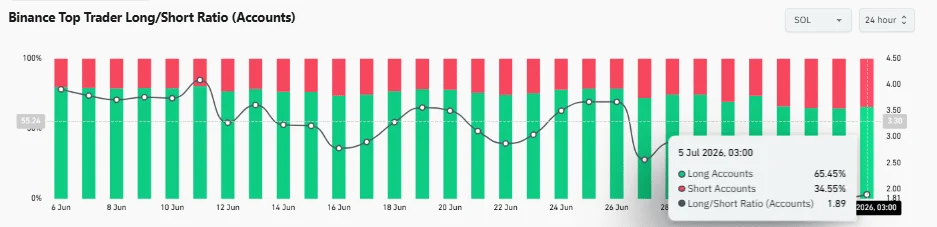
Despite SOL’s rebound from June’s bottom levels, sophisticated traders have maintained their long exposure rather than taking profits. This behavior indicates that institutional market participants continue anticipating additional upward movement.
The OI-Weighted Funding Rate currently registers at a positive 0.0027%, indicating leveraged traders are compensating to maintain long positions. Funding rates have remained in positive territory throughout the recent recovery phase without approaching levels that would suggest excessive speculation.
Critical Resistance and Support Zones
SOL is presently challenging resistance around the $84 level. Buyers have successfully defended the $78.07 support threshold, maintaining the near-term bullish framework.
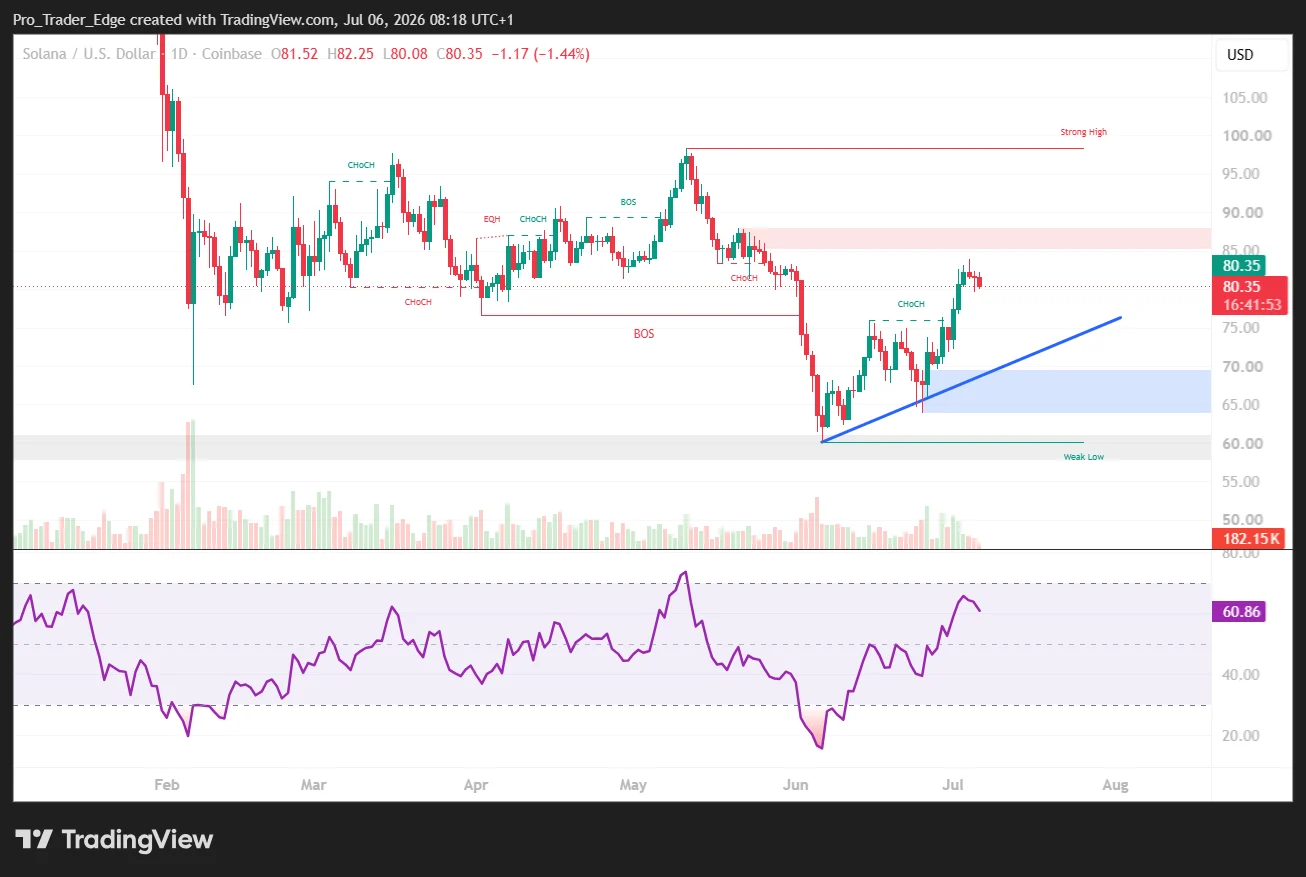
The daily RSI measures 61.20, while its Moving Average stands at 52.66. Both indicators demonstrate that accumulation pressure persists above neutral territory.
A decisive break above $84 would probably clear the pathway toward $90. Conversely, failure to penetrate that barrier could trigger a pullback to retest the $78.07 support zone.
Examining the weekly timeframe, analyst TraderJB spotted bullish RSI divergence near what he identifies as the conclusion of a wave C corrective pattern. He observed that identical divergence materialized in opposite form at the prior peak before the correction initiated.
TraderJB characterized the present zone as offering favorable risk-reward dynamics for spot accumulation if his wave analysis proves accurate.
SOL’s most pressing challenge remains conquering the $84 resistance barrier, with subsequent objectives at $90 and $100 if buyers can preserve the current technical structure.
Get 3 Free Stock Ebooks
Discover top-performing stocks in AI, Crypto, and Technology with expert analysis.
- Top 10 AI Stocks - Leading AI companies
- Top 10 Crypto Stocks - Blockchain leaders
- Top 10 Tech Stocks - Tech giants



