
 Struggles Below $72 as Bearish Momentum Overshadows ETF Inflows")
Key Takeaways
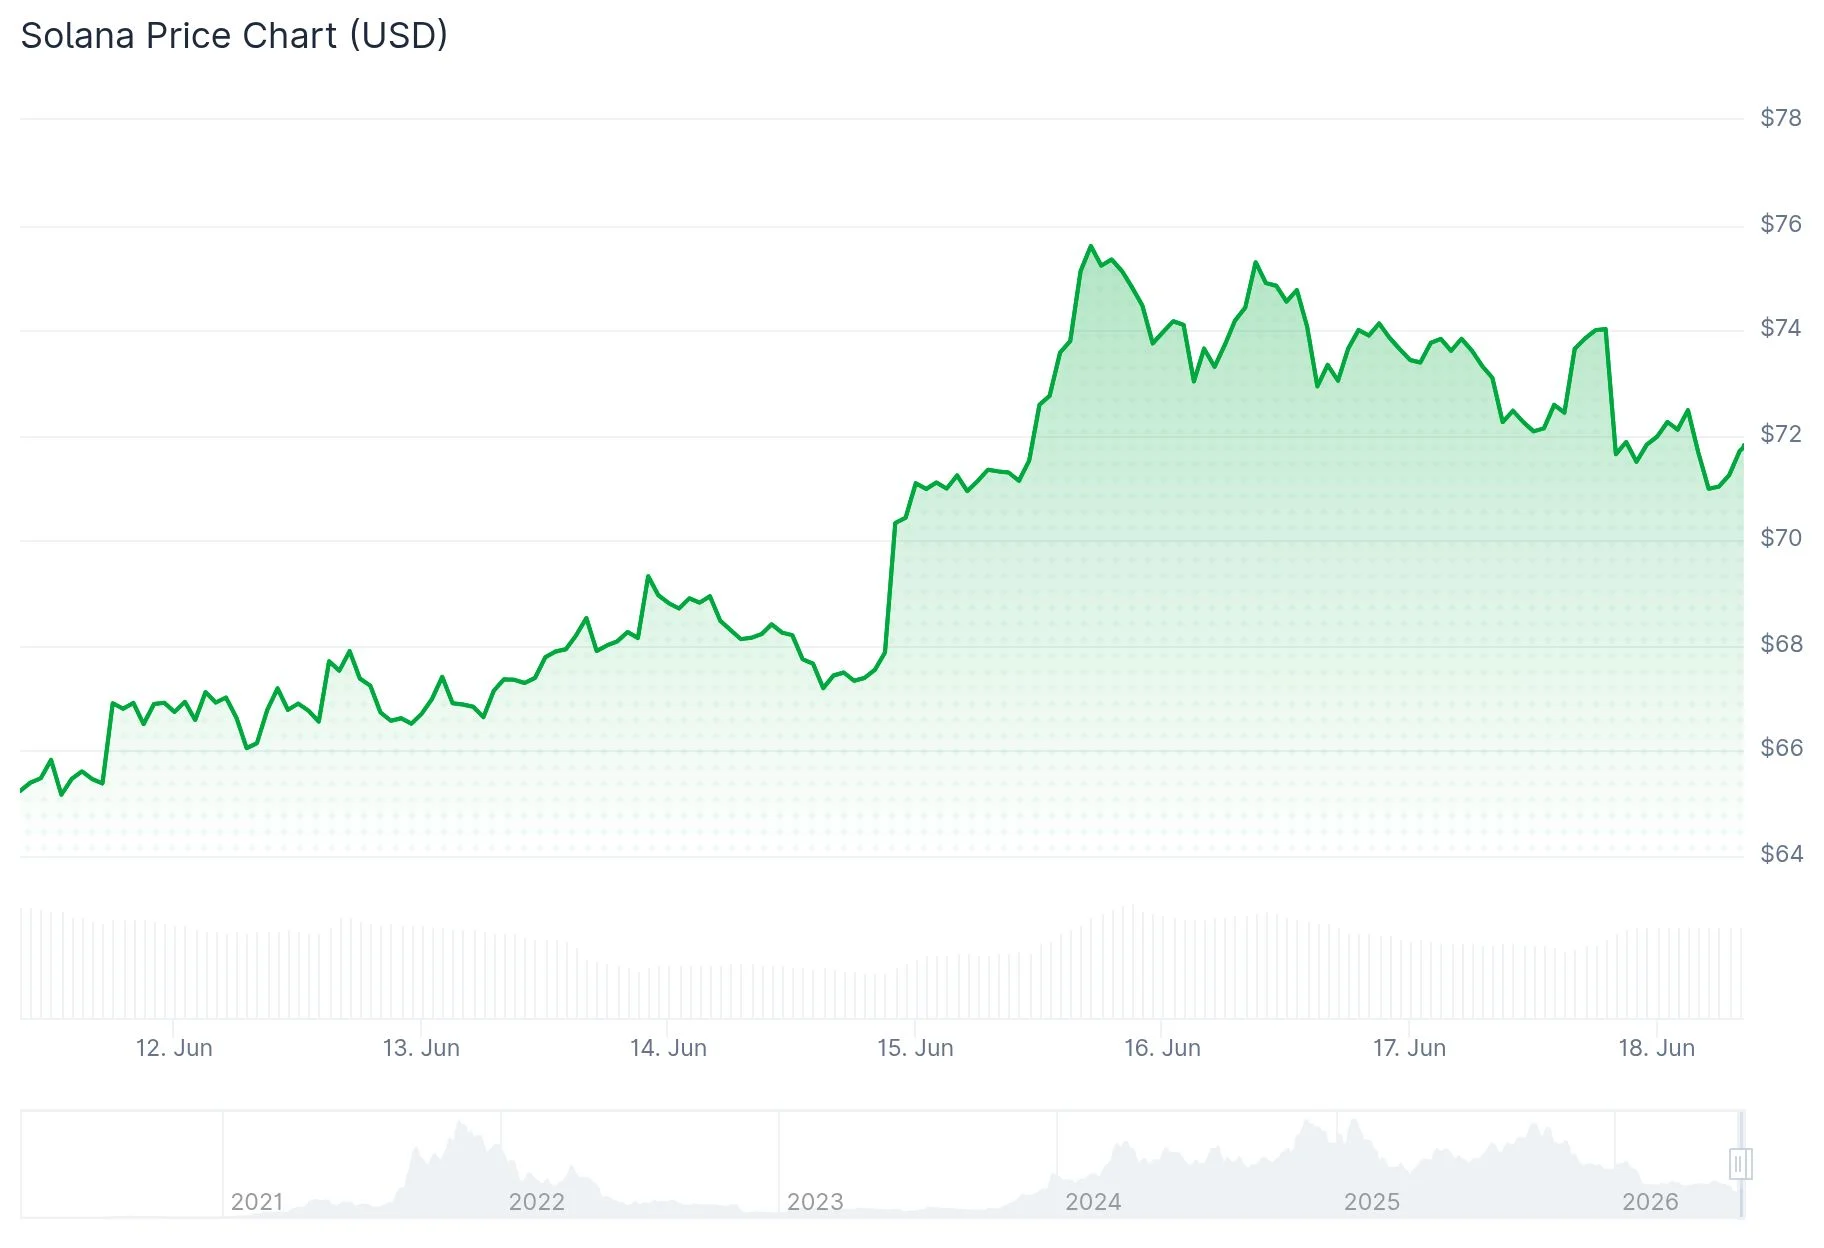
- SOL has dropped below $72, losing more than 2.5% over the past 48 hours.
- ETF products saw net inflows of $1.06 million on Wednesday, marking three consecutive days of positive flows.
- The long-to-short ratio stands at 0.91, indicating bearish positioning among traders.
- Negative funding rates have emerged, with short sellers now compensating long holders — a classic bearish indicator.
- Technical analyst BATMAN highlighted that former support has converted to resistance, while the Stochastic oscillator signals overbought conditions.
Solana (SOL) continues its downward trajectory on Thursday, hovering around $71 after shedding over 2.5% in the previous two trading sessions. The cryptocurrency remains firmly positioned beneath critical moving average levels.
While price action remains weak, institutional interest shows signs of life. Spot Solana ETF products attracted $1.06 million in net capital on Wednesday, per SoSoValue tracking data. This represents the third straight session of positive fund flows this week.
Yet these institutional inflows haven’t translated into upward price movement. Data from the derivatives market continues to reflect bearish sentiment.
According to CoinGlass metrics, Thursday’s long-to-short ratio for SOL registered at 0.91. Any figure under 1.0 indicates that more market participants are wagering on price depreciation. This marks one of the lowest readings observed in the past month.
Funding rates flipped negative earlier this week and currently sit at -0.0036% on Thursday. When funding rates turn negative, it means short position holders are compensating long position holders — a clear indication that pessimistic bets are prevailing in the market.

Critical Resistance Level Identified by Analyst
On June 17, cryptocurrency analyst BATMAN published technical observations warning that SOL has been turned away at a price zone that previously acted as support but has now converted to resistance. This type of role reversal typically signals bearish momentum in chart analysis.
BATMAN further pointed out that the Stochastic indicator has entered overbought territory — a condition that preceded the previous significant price top. These technical factors indicate SOL may encounter additional selling pressure unless demand increases substantially.
Looking at the wider timeframe, SOL is currently positioned below its 50-day, 100-day, and 200-day Exponential Moving Averages (EMAs). All three indicators remain significantly above the current trading price, reinforcing the bearish structural setup.
Market analyst Daan Crypto Trades (@DaanCrypto) observed on June 16 that SOL was working to break out from a descending wedge formation versus Bitcoin. He mentioned that a confirmed breakout could catalyze gains for SOL and related ecosystem tokens, though he cautioned that resistance remained intact at that juncture and required close monitoring.
Technical Indicators Show Conflicting Signals
The Relative Strength Index (RSI) currently registers around 44 on the daily timeframe — marginally below the neutral threshold but climbing from oversold territory. The MACD indicator has generated a bullish crossover, with the MACD line positioned at -2.80 above the signal line at -4.09, while the histogram displays a positive reading of +1.29.
These technical developments point to emerging buyer interest, though market observers emphasize that stronger momentum is required before any trend reversal can be validated.
Solana has bounced from the $60–$64 support region observed in recent weeks. The asset currently trades above the middle Bollinger Band at $71.20, while upper band resistance stands at $84.07.
Critical overhead resistance zones include $74.75 (the 38.2% Fibonacci retracement level), $77.07, and $79.27. Near-term support is positioned around $69.16, with the cycle bottom near $60.13 serving as a deeper support target.
As of this writing, SOL posts a 24-hour trading volume of $4.26 billion against a market capitalization of $42.56 billion, down 0.56% over the past day.
Get 3 Free Stock Ebooks
Discover top-performing stocks in AI, Crypto, and Technology with expert analysis.
- Top 10 AI Stocks - Leading AI companies
- Top 10 Crypto Stocks - Blockchain leaders
- Top 10 Tech Stocks - Tech giants


