
 Sinks Below $80 Amid Rising Geopolitical Uncertainty")
Key Highlights
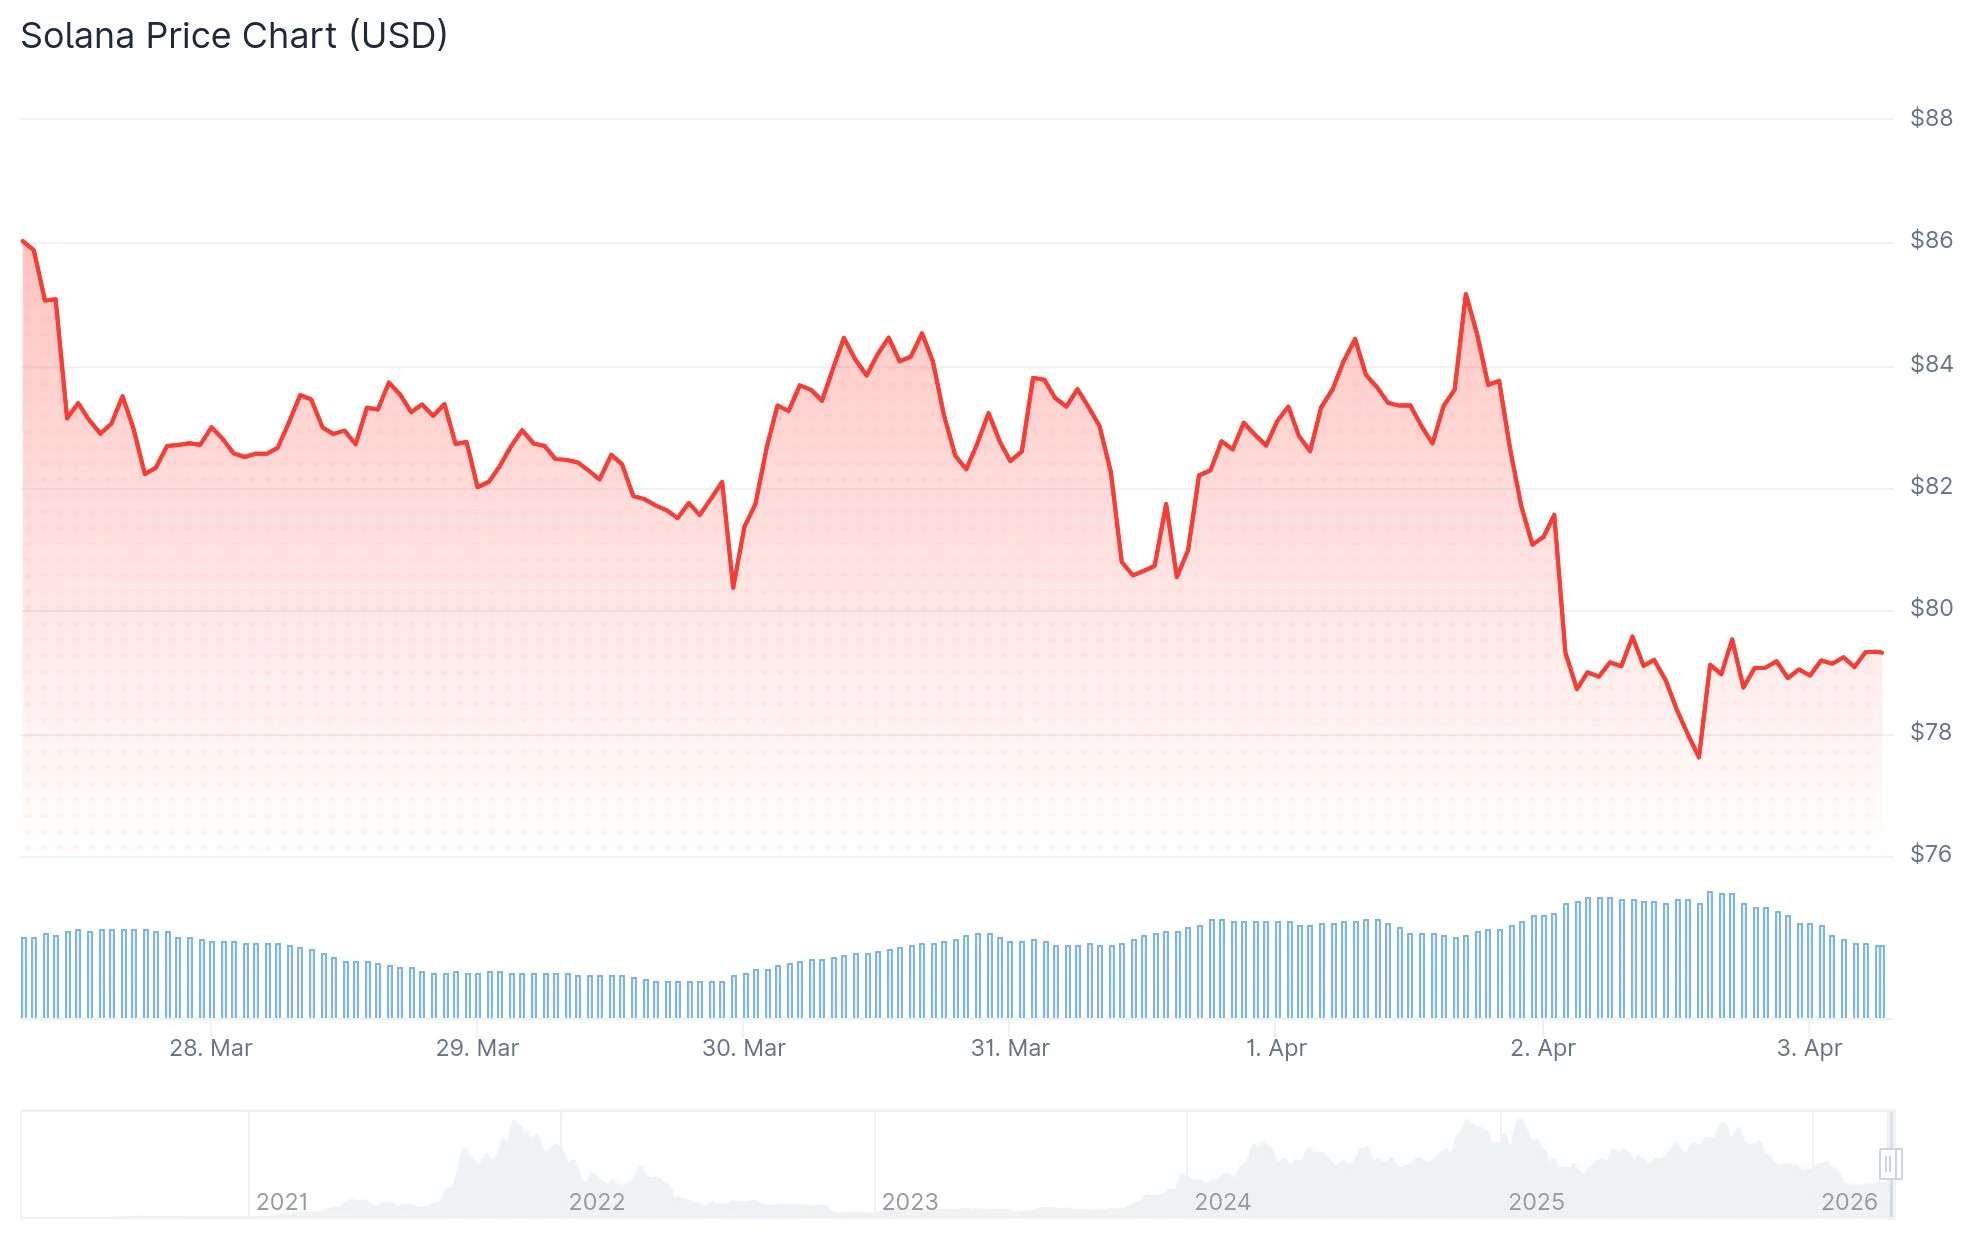
- SOL experienced a 5.4% decline, sliding below the $80 threshold as geopolitical worries tied to Trump’s Iran warnings triggered market-wide selling
- Critical overhead resistance zone identified between $82.22 and $85.94; losing $78 support could accelerate decline toward $67
- Liquidations of long positions surpassed $20 million within a 24-hour window, indicating intensifying downward pressure
- Daily chart RSI has fallen beneath the 40 level, validating the bearish trend continuation
- Market observers identify $50–$60 range as the next significant demand area should current support zones collapse
Solana (SOL) experienced significant downward pressure throughout the last 24-hour period, declining 5.4% and breaching the $80 threshold as market sentiment deteriorated broadly. The primary catalyst for this selloff stems from escalating geopolitical concerns, particularly President Donald Trump’s recent statements threatening to strike Iran with extreme force in the upcoming weeks.
Oil prices surged toward the $110 mark following these announcements. This sharp increase in energy costs has reignited inflation worries and prompted market participants to reassess their expectations for Federal Reserve monetary policy adjustments in 2026. Historically, diminished rate cut prospects create headwinds for speculative assets including cryptocurrencies.
Immediate overhead resistance has formed within the $82.22 to $85.94 corridor. This technical zone encompasses multiple Fibonacci retracement levels including the 23.6%, 38.2%, and 50.0% markers. Any attempted recovery pushing into this region may encounter renewed selling pressure unless substantial buying interest materializes.
Volume Surge and Liquidation Data Reveal Bearish Momentum
Trading activity for Solana surged by 30% over the past day, climbing to approximately $6 billion—a figure representing roughly 13% of the token’s total circulating market capitalization. This substantial volume increase signals aggressive selling behavior from market participants.
Long position liquidations exceeded the $20 million mark during this timeframe. Should this metric climb above $25 million, it would represent one of the most severe liquidation events for SOL bulls since early February, when the token plummeted from $100 down to $78.

The Relative Strength Index displayed on the daily timeframe has declined below 40, a technical threshold that generally validates strengthening bearish momentum. Additionally, three consecutive sell signals have emerged on the 4-hour chart, indicating that institutional-level participants are actively reducing their positions.
Losing the $78 support threshold would create a pathway toward $67, representing an additional 13% decline from present price levels.
Long-Term Technical Structure Suggests Further Downside
Examining extended timeframes, analyst James Easton published a 14-day chart illustrating SOL’s movement within a tightening descending channel formation. The technical pattern displays a sequence of lower peaks and lower troughs extending from the late 2024 to early 2025 high.
Solana maintained robust support within the $110 to $120 range previously. However, this level has now transitioned into a resistance barrier. Market analysts emphasize that inability to recapture the $100–$110 territory maintains downside vulnerability, with $60 followed by $50 marked as the subsequent major accumulation areas.
Each recovery attempt has thus far been unable to disrupt the pattern of declining peaks. With long position liquidations surpassing $20 million in just the past 24 hours, short sellers maintain a tactical advantage should the $78 level fail to provide adequate support.
Get 3 Free Stock Ebooks
Discover top-performing stocks in AI, Crypto, and Technology with expert analysis.
- Top 10 AI Stocks - Leading AI companies
- Top 10 Crypto Stocks - Blockchain leaders
- Top 10 Tech Stocks - Tech giants


