
 Rallies 20% as Traders Zero In on Critical Resistance Zone")
Key Highlights
- Solana has rallied more than 20% from early June lows around $60, currently hovering near $75
- The asset is retesting a critical $75.7 support-turned-resistance zone that could unlock moves toward $83.5, $90, and $98
- Technical analyst Satoshi Flipper identifies a falling wedge pattern break targeting $250 long-term
- Daan Crypto Trades notes SOL attempting to break from a consolidation wedge versus BTC, awaiting confirmation
- Crypto Coral raises caution with bearish flag pattern, warning rejection could trigger further downside
Solana has mounted an impressive comeback from its June bottom, adding over 20% in value within days. This bounce has pushed SOL back to a pivotal price level that technical traders believe could determine the token’s trajectory.
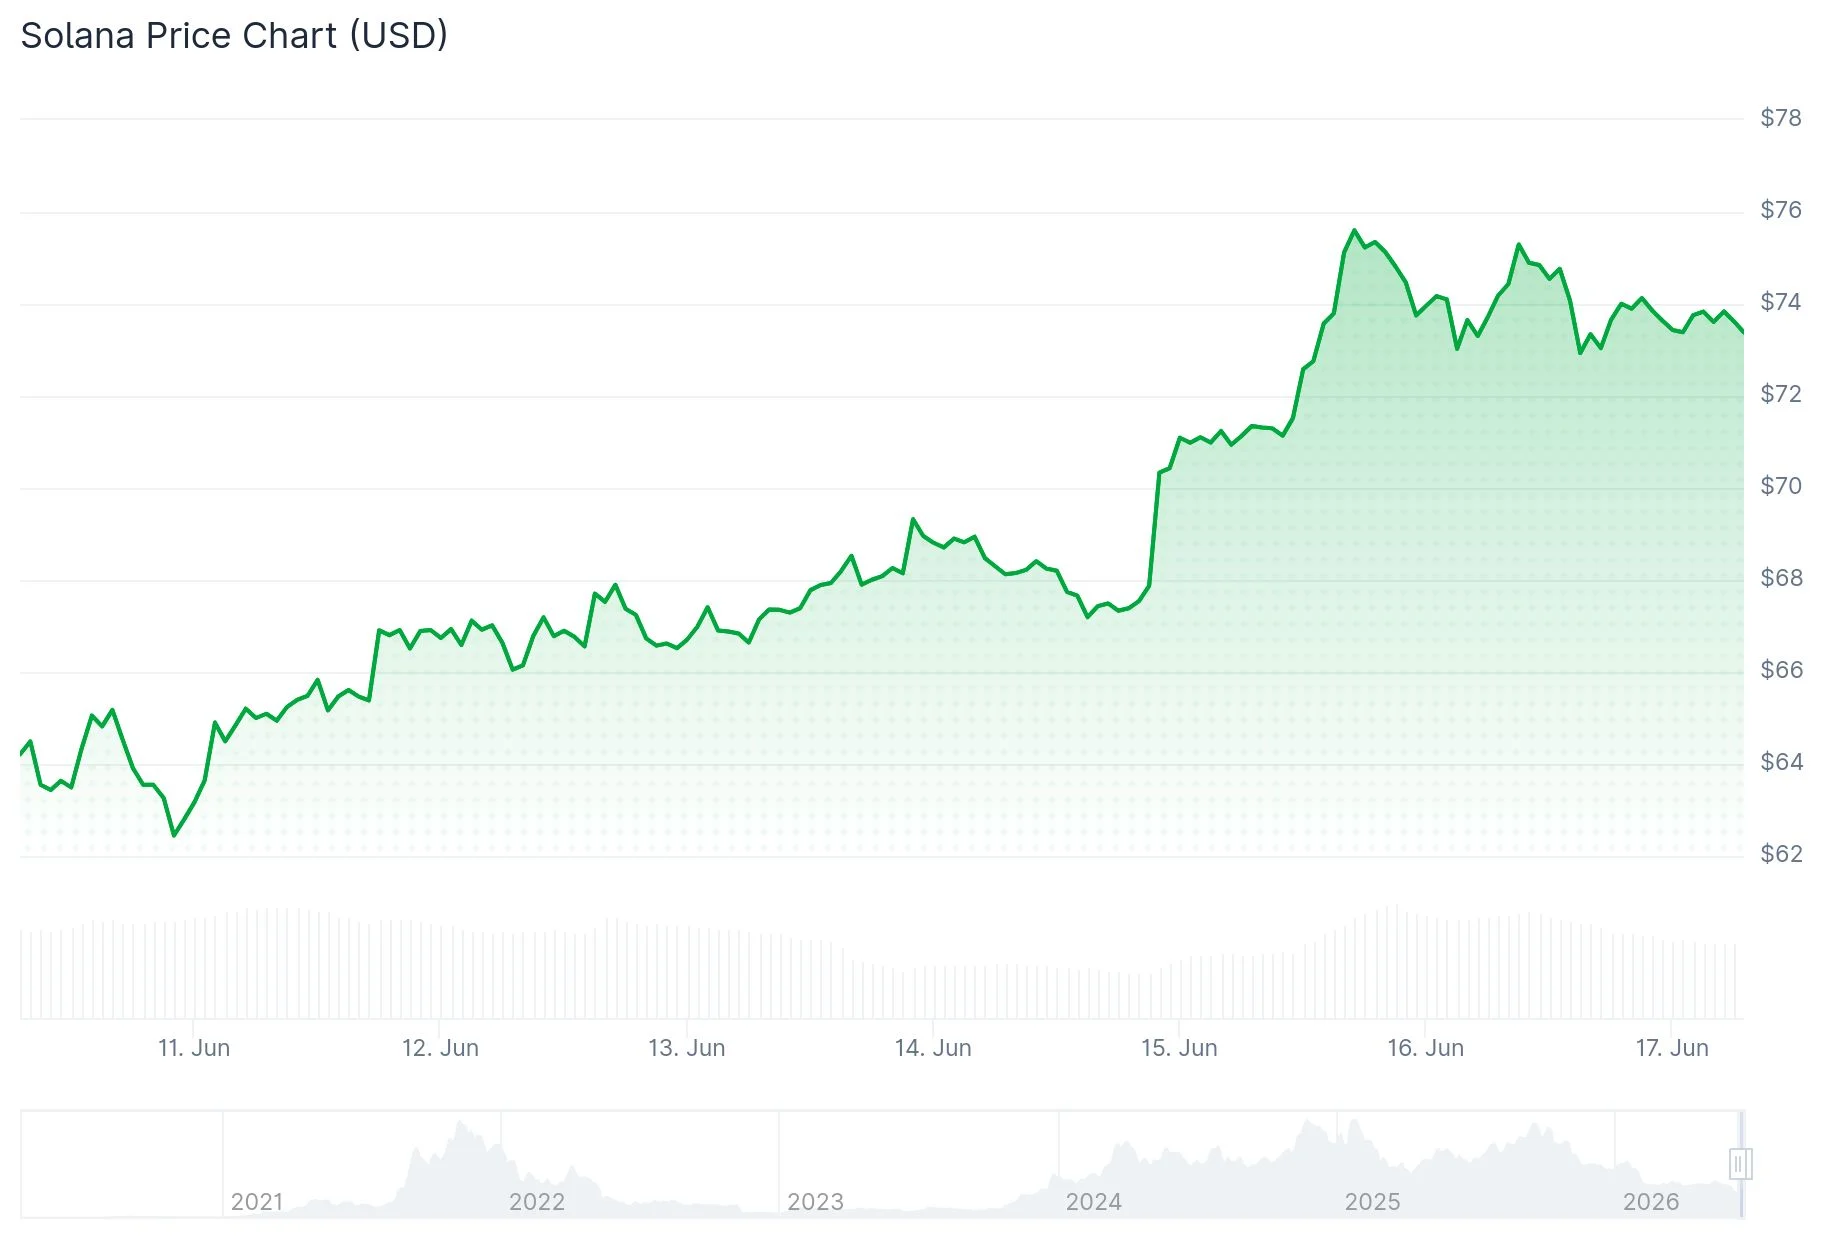
On June 16, Solana was changing hands around $75, representing a significant recovery from the sub-$60 levels witnessed earlier this month.
The rebound gained momentum from positive macroeconomic developments. News emerged that the United States and Iran had agreed on a preliminary framework to ensure the Strait of Hormuz remains open, alleviating inflationary pressures. Crude oil prices declined following this announcement, providing a tailwind for Bitcoin, Ethereum, and broader risk-on assets.
Derivatives market activity supported the rally’s legitimacy. Data from CoinGlass indicated that open interest expanded in tandem with the price surge. Short squeeze liquidations also contributed to the rapid climb from the low $60s to present levels.
On the business front, Solana Company turned down a non-binding takeover bid from Forward Industries dated June 15. The proposal offered a premium to current market valuation and emerged as corporate players increasingly explore SOL-focused treasury allocation strategies.

Technical Picture Analysis
Examining the daily timeframe reveals that Solana traded within a defined range for approximately four months, bounded by $75.7 support and $98.3 resistance. This consolidation pattern collapsed in early June when price breached the lower boundary and descended toward $60.
SOL has now returned to challenge that previous support floor. A decisive reclaim of this range would negate the bearish breakdown and bring $83.5, $90, and ultimately $98.3 back into focus as upside targets.
The four-hour chart shows SOL piercing through a downward-sloping trendline that had contained rallies since May’s conclusion. The Relative Strength Index has recovered above the 50 midpoint after dipping into oversold territory, while the MACD indicator is beginning to curl upward.
Trader Daan Crypto Trades shared via X that SOL appears to be breaking out from a consolidation wedge formation relative to BTC. He suggested a confirmed breakout could catalyze gains across select Solana ecosystem tokens, though he emphasized current price action faces meaningful resistance.
Analyst Satoshi Flipper detected a falling wedge breakout pattern on the daily timeframe, with price successfully reclaiming the upper boundary near $70. The analyst projects a long-term price objective of $250, which would represent a return to valuations last seen during Solana’s previous bull cycle peak.
Critical Zones for Bulls and Bears
More Crypto Online pointed to a concentrated Fibonacci resistance cluster spanning $69.44 to $72.58 on the four-hour timeframe, where the 38.2% retracement level, 100% Elliott Wave extension, and 50% retracement converge to form a technical barrier.
Not every market observer shares the bullish outlook. Crypto Coral issued a warning on June 16 that Solana has experienced a bearish flag breakdown and is currently retesting crucial exponential moving average resistance. According to this analysis, failure to recapture this zone opens the door for additional downside.
Should the $75 level fail to provide support, subsequent downside targets include $71.8, $69.1, and potentially a retest of the June low near $60.
The Supertrend technical indicator on the four-hour chart currently places support at approximately $70.9.
Get 3 Free Stock Ebooks
Discover top-performing stocks in AI, Crypto, and Technology with expert analysis.
- Top 10 AI Stocks - Leading AI companies
- Top 10 Crypto Stocks - Blockchain leaders
- Top 10 Tech Stocks - Tech giants


