
 Price Struggles at $85 Resistance After Six Failed Breakout Attempts")
Key Takeaways
- Solana has declined 33% in 2025, ranking as the poorest performer among the top five cryptocurrencies
- On-chain transaction volume has contracted for nine straight weeks, sitting 32% beneath recent highs
- Price has been rejected at $90 on six separate occasions; trading remains confined to the $77–$90 corridor
- The weekly RSI indicator moved above its signal line in mid-April, echoing a formation that preceded a 2,400% surge in 2022
- Historical parallels suggest SOL may retreat to the lower $50s before initiating its next significant upward movement
Solana (SOL) is currently changing hands around $84 following a bounce from support at $81.40 and a subsequent modest rebound. The digital asset regained ground above $83.50 and successfully breached a downward-sloping trend line that had been serving as resistance at $83.45 on the one-hour chart.
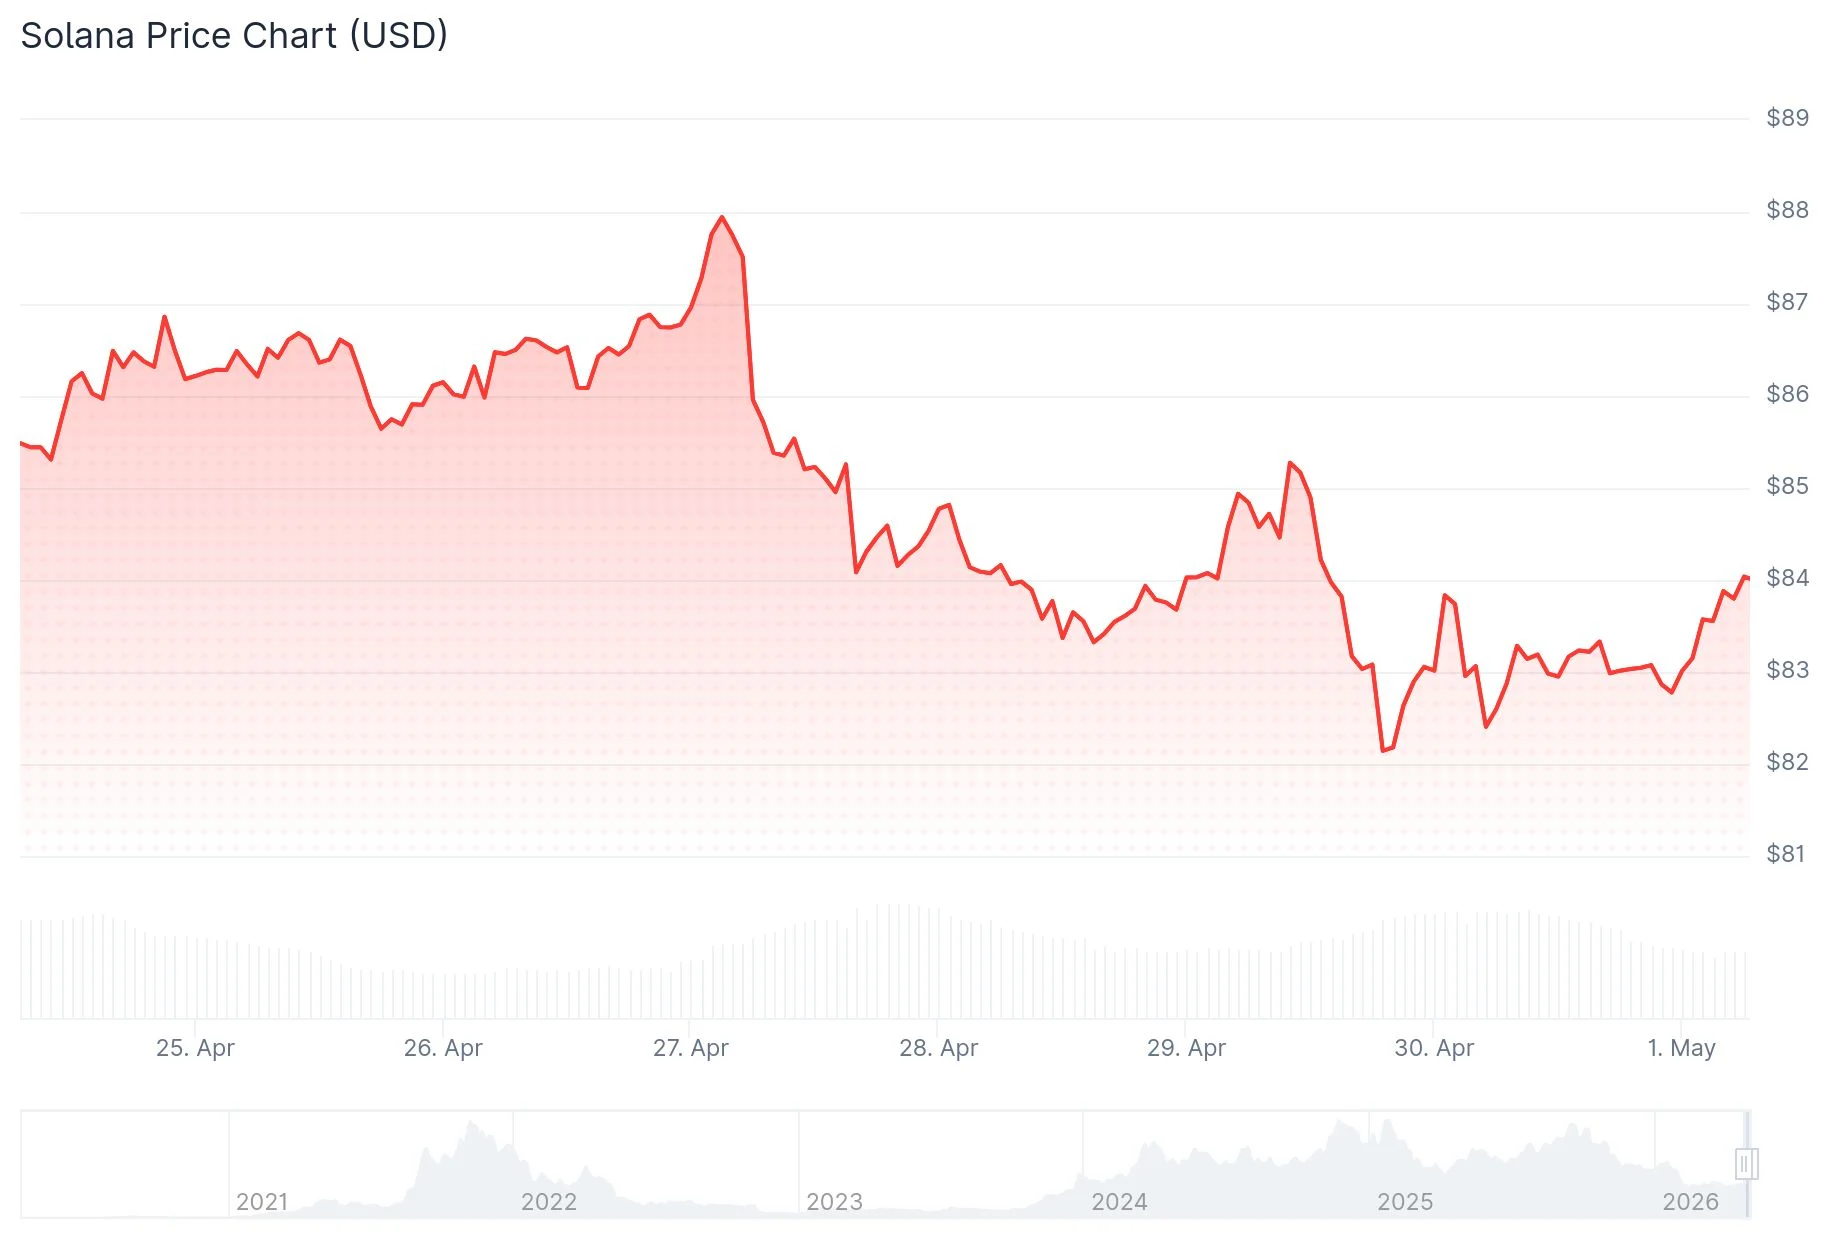
This upward movement occurred in tandem with comparable rallies in Bitcoin and Ethereum. SOL managed to climb past the 50% Fibonacci retracement zone of its latest decline from $85.48 down to $81.40.
However, the rally appears capped as sellers continue to defend levels below $85. The first barrier stands at $84.50, followed by a more substantial resistance zone at $85.50. Breaking decisively above $87 would be essential to unlock a pathway toward $92 and potentially $102.
Should SOL prove unable to overcome $85.50, downside support levels come into focus at $83.45, followed by $82.50, and then $81.40. A daily close beneath $81.40 could accelerate selling pressure toward the $77 region.
On-Chain Metrics Paint a Bearish Picture
Blockchain data reveals a concerning trend. Solana’s transaction count has contracted for nine consecutive weeks. Current levels stand 32% lower than the peak of 959 million transactions recorded during the week that concluded on February 8.

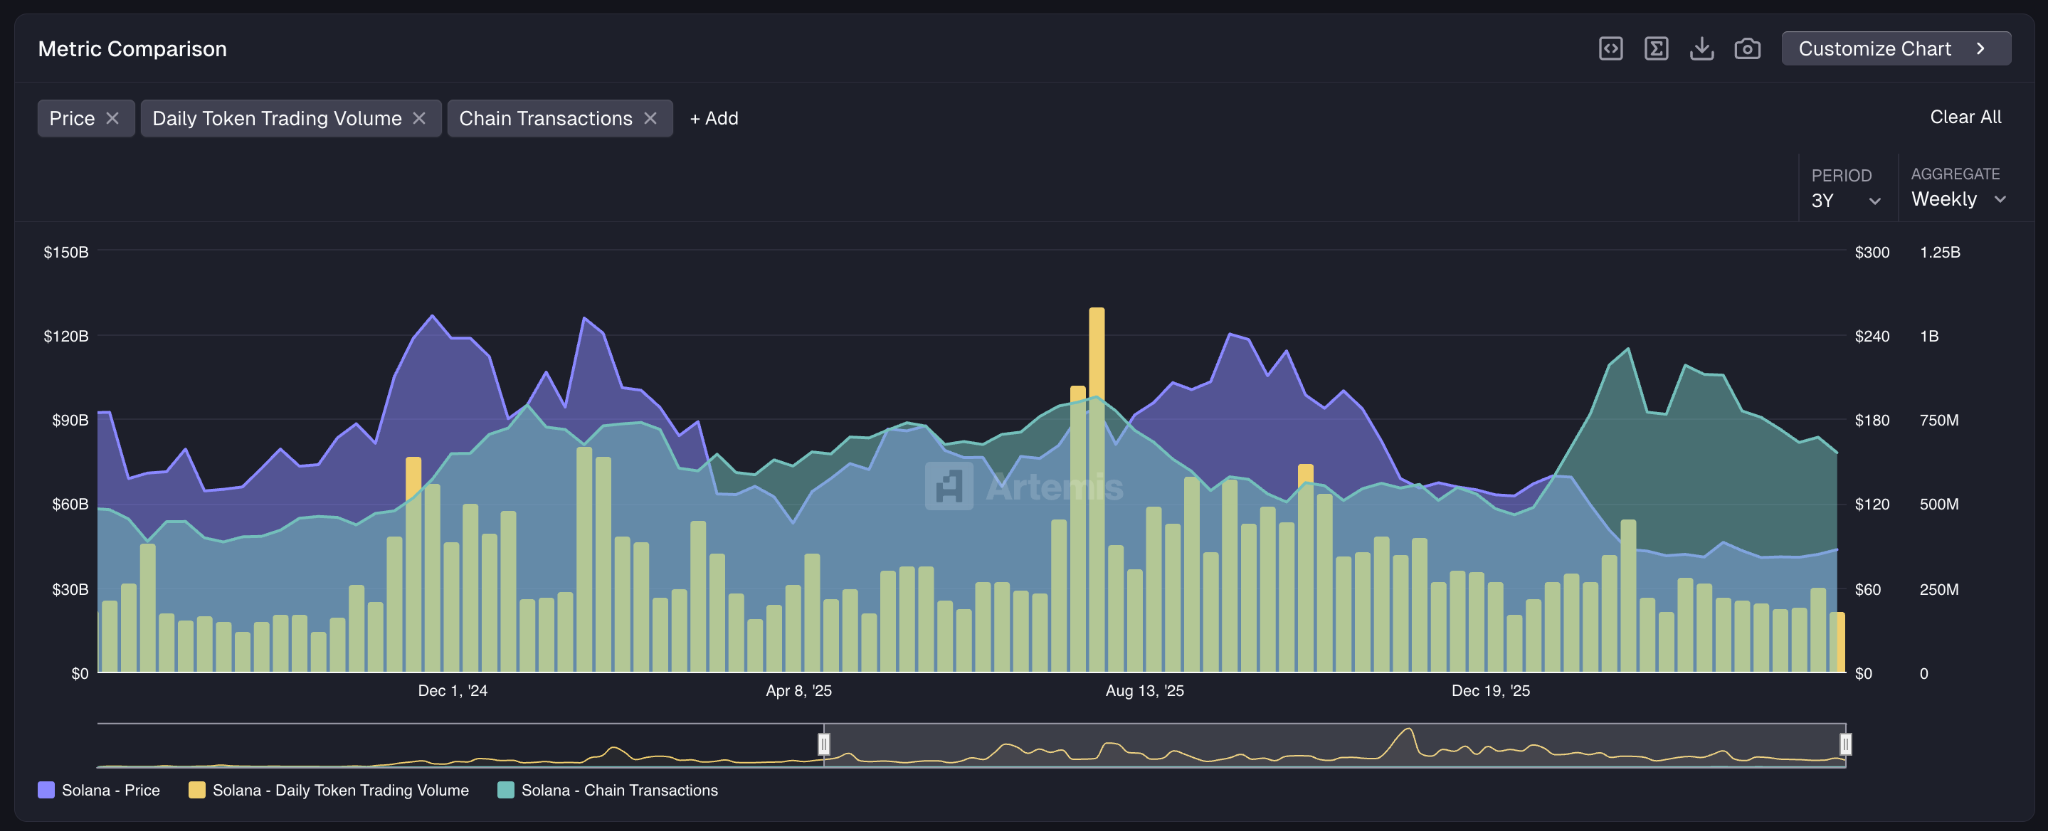
Trading activity has also diminished significantly. The previous week registered $22 billion in SOL trading volume — approximately half the levels observed during the April–September 2025 bull run, and merely 20% of historical peak volumes.
Solana notably lagged behind during April’s broader market recovery. While Bitcoin posted gains of 14% and Ethereum advanced 10%, SOL managed only a modest 2.8% increase.
On a year-to-date basis, SOL has surrendered 33% of its value, establishing it as the weakest performer within the top five digital assets by market capitalization.
Macroeconomic Headwinds Intensify
The wider macroeconomic landscape continues to pressure alternative cryptocurrencies. The PCE Price Index accelerated from 2.8% in February to 3.5% in March, indicating mounting inflation pressures primarily attributed to surging energy costs. Crude oil prices have climbed back above $100 per barrel as the U.S. blockade of the Strait of Hormuz persists.
The Federal Reserve maintained interest rates at its most recent policy meeting, with market expectations pointing toward zero rate reductions throughout the remainder of the year. Jerome Powell delivered his concluding remarks as Fed Chair, while the FOMC displayed notable internal divisions regarding future policy direction.
Market participants are retreating from higher-risk investments. Capital continues flowing into Bitcoin and Ethereum, while demand for altcoins such as SOL remains notably subdued.
Technical Indicator Suggests Potential Decline to $50
Solana’s weekly RSI touched 30 in February before crossing above its 14-week moving average during mid-April. A strikingly similar technical formation materialized in November 2022 — however, before the subsequent rally commenced, SOL first declined from $13 to $9.
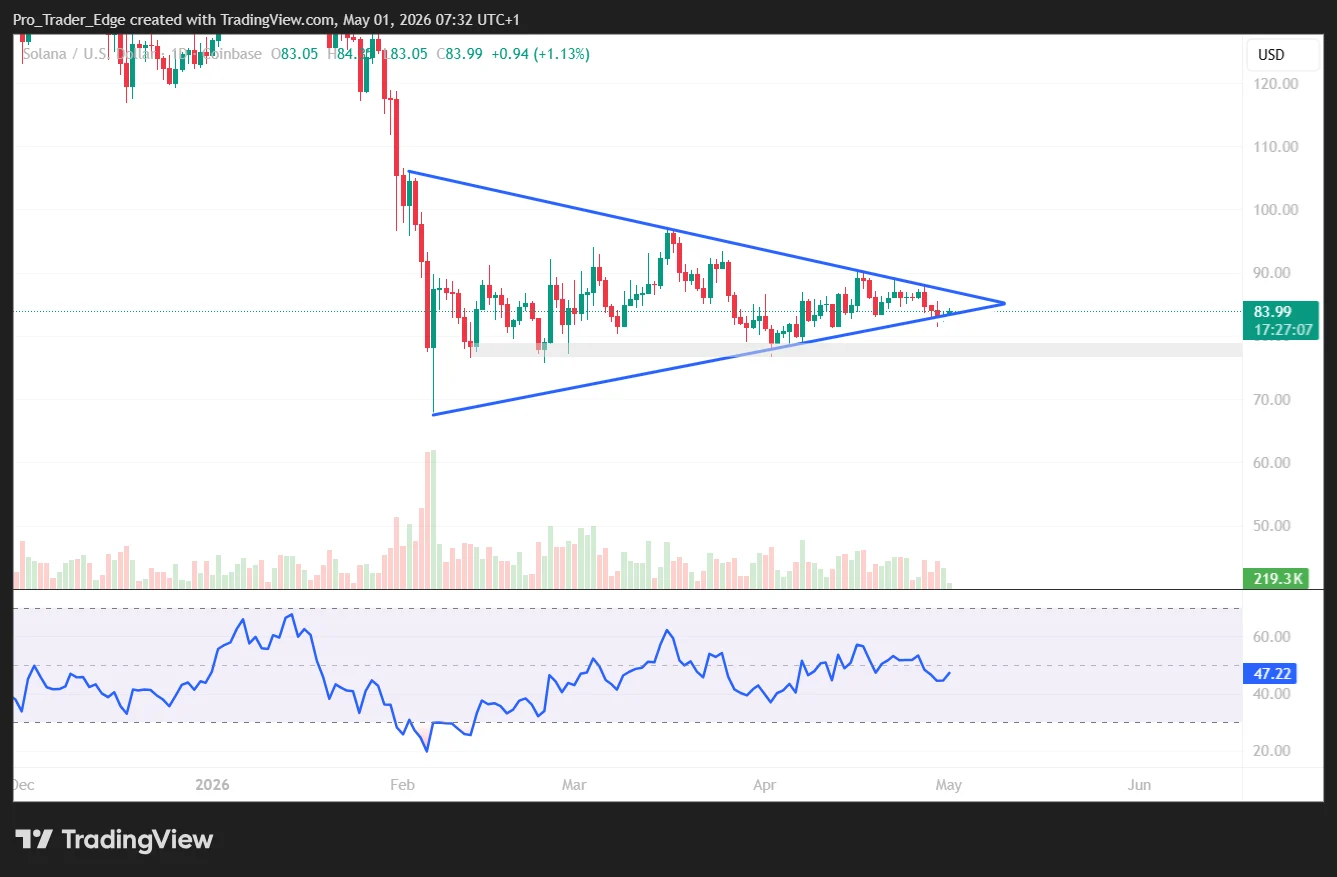
Should this historical precedent repeat itself, SOL could retreat to the lower $50s before establishing a foundation for its next sustained upward trajectory.
SOL has been oscillating within a $77 to $90 range for the past two months. Bulls have made multiple attempts to break above $90 but have been consistently repelled by aggressive selling. The price structure remains locked in consolidation mode.
Get 3 Free Stock Ebooks
Discover top-performing stocks in AI, Crypto, and Technology with expert analysis.
- Top 10 AI Stocks - Leading AI companies
- Top 10 Crypto Stocks - Blockchain leaders
- Top 10 Tech Stocks - Tech giants


