
 Price Enters Critical Week as Bulls Defend $82 Support")
Key Takeaways
- SOL currently trades around $84, experiencing a 2.35% decline across the last seven days with a $48.45 billion market capitalization.
- The network dominates Layer 1 and Layer 2 platforms in both DApp revenue generation and decentralized exchange trading volume.
- Open interest climbed marginally to $4.84B, though trading volume contracted 26.79%, signaling trader hesitation.
- Critical resistance level stands at $88.77 with support anchored at $81.94, while MACD indicates diminishing momentum.
- Crypto analyst CryptoJack identified the coming week as crucial for determining whether SOL breaches its trendline or faces another rejection.
Solana maintains its position around $84 following a steep correction from its $140 February peak. The digital asset has consolidated within a narrow price band as market participants await a definitive directional move.
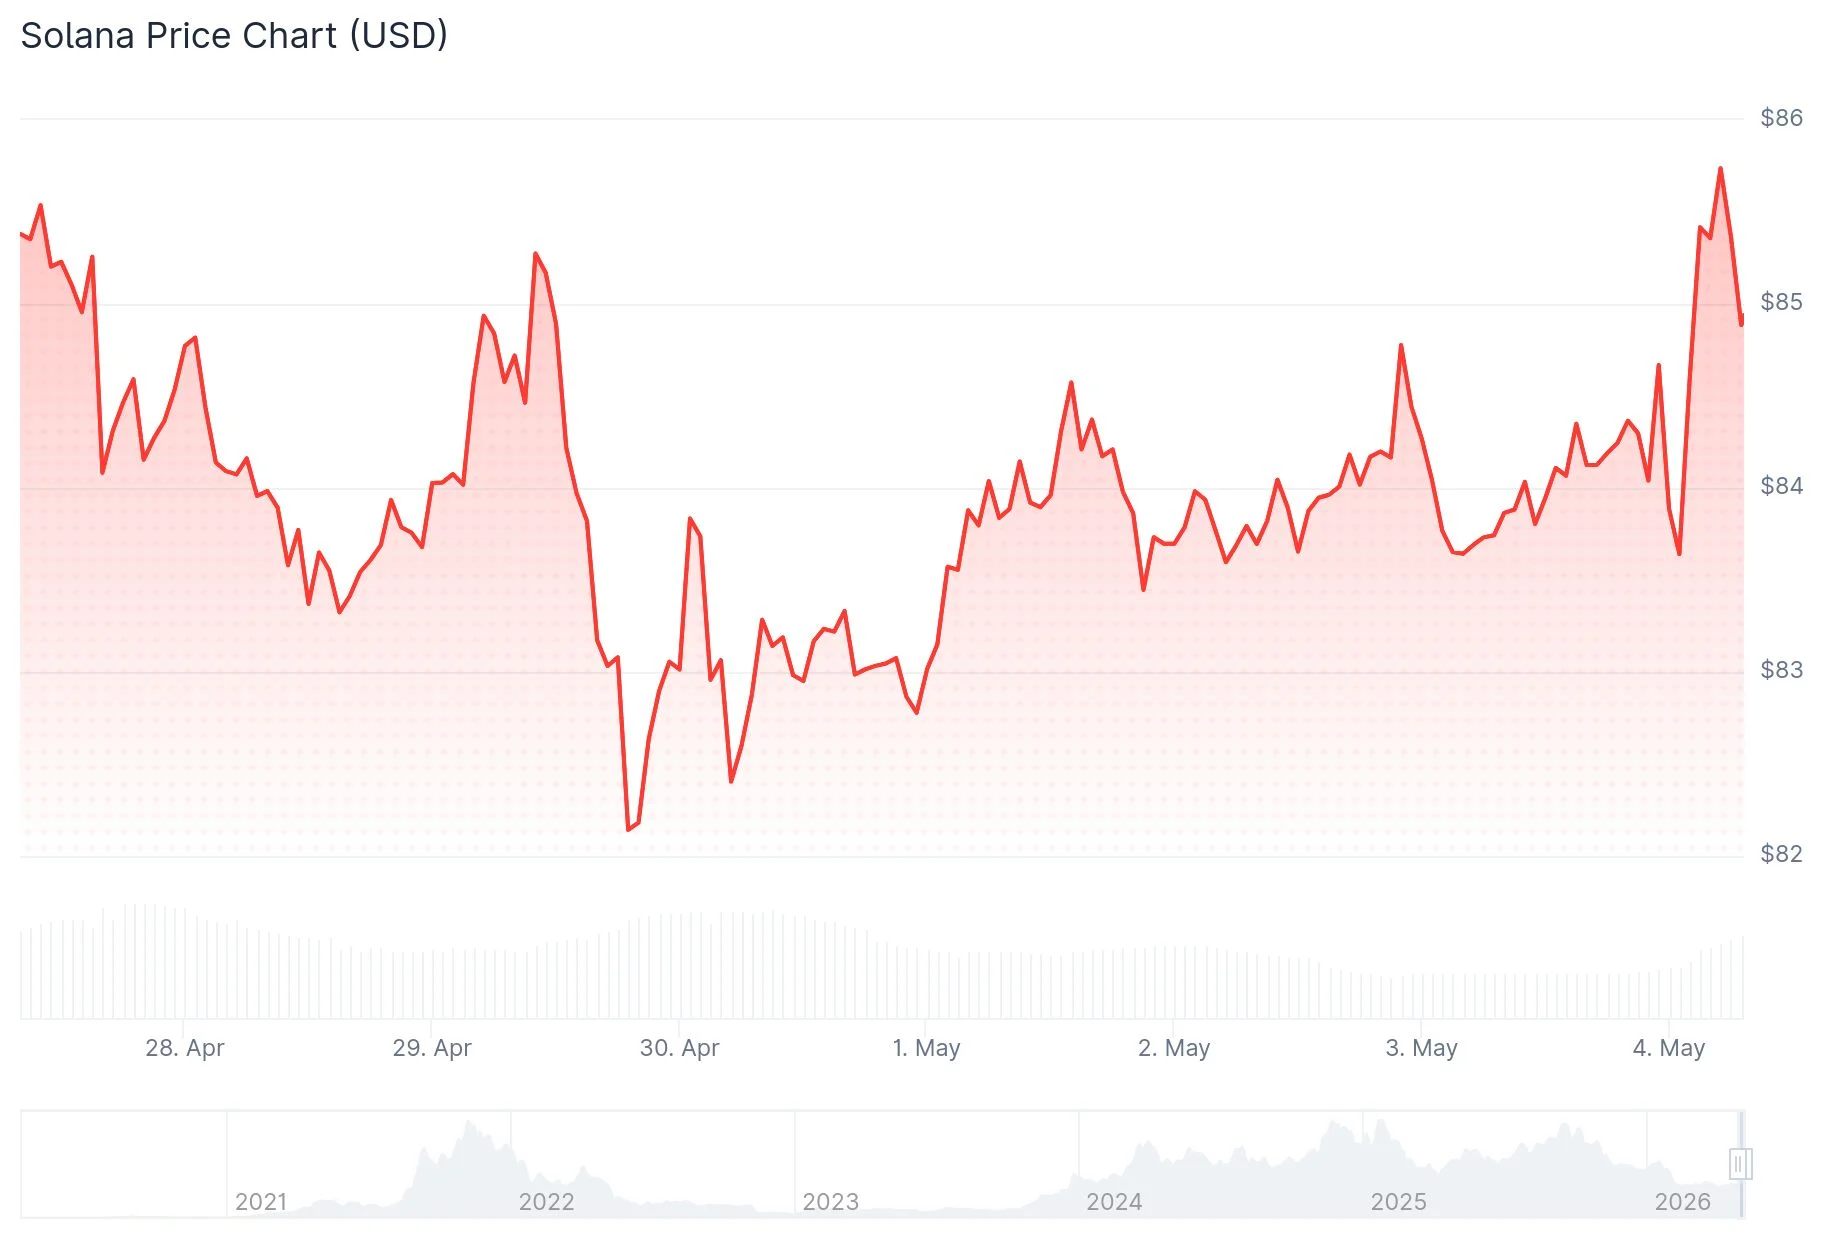
CoinMarketCap data reveals SOL trading at $84.07 with $2.41 billion in 24-hour volume and a $48.45 billion market valuation. The asset has shed 2.35% over the previous week.
Demand has emerged in the $82-$83 range, establishing a near-term price floor. Technical analyst BitGuru highlighted this zone’s significance on May 1, emphasizing that sustained spot buying—rather than leveraged speculation—is necessary for bulls to maintain control.
Crypto analyst CryptoJack posed a direct question to the community: “Will it break the trendline and hold above it? Or get rejected at resistance and move lower?” — positioning the upcoming week as a pivotal period for SOL’s trajectory.
Network Fundamentals Continue to Shine
While price action remains subdued, Solana’s underlying network metrics tell a different story. According to Solana Floor analytics, the blockchain outperforms all competing Layer 1 and Layer 2 networks in both daily and weekly DApp revenue alongside DEX volume.

Minimal transaction costs combined with rapid settlement capabilities continue to attract high-frequency traders and DeFi participants. These network strengths maintain Solana’s competitive edge in on-chain performance despite sideways price movement.
Futures Markets and Technical Analysis
In derivatives markets, open interest registered a modest 0.09% increase to $4.84 billion, contrasting with a 26.79% volume decline to $4.45 billion. Coinglass metrics reveal an OI-weighted funding rate of -0.0073%, suggesting mild bearish positioning among perpetual contract traders.
Solana currently trades beneath its 20-day simple moving average, with the MACD indicator hovering near zero and displaying minimal directional strength. The primary resistance barrier appears at $88.77, while support holds firm at $81.94.
Liquidation mapping reveals concentrated short positions between $84 and $87. A rally into this territory could spark cascading liquidations, though sustained movement above $88-$90 would be required for bullish confirmation.
ETF flows contribute to the cautious outlook. SOLZ experienced a $585,473 outflow on May 1. April witnessed total Solana ETF inflows of merely $38.7 million—the lowest monthly recording despite approaching $1 billion in cumulative inflows.
The Bitwise Solana Staking ETF (BSOL) provided a notable exception, attracting $6.2 million on April 24, representing approximately 1% of its $611.8 million total assets.
SOL must recapture the $106.24 level before broader bullish continuation becomes viable. Currently, the token remains trapped between well-defended support and formidable overhead resistance.
Get 3 Free Stock Ebooks
Discover top-performing stocks in AI, Crypto, and Technology with expert analysis.
- Top 10 AI Stocks - Leading AI companies
- Top 10 Crypto Stocks - Blockchain leaders
- Top 10 Tech Stocks - Tech giants


