
 Eyes Breakout as Cup and Handle Pattern Takes Shape — Key Resistance Level in Focus")
Key Takeaways
- A monthly cup and handle pattern is developing on SOL’s chart following its recovery from 2022 bear market lows
- Price action has been confined within a $78 to $98 trading range since February, with $88 serving as the central pivot
- Technical analyst Ali Charts highlights that a confirmed daily close above $98 could trigger moves toward $107 and potentially $117
- SOL successfully escaped a multi-month descending channel and is now stabilizing in the $92-$95 zone
- Critical support zones include $92, $89, and $78 — a breakdown below $78 could invalidate the bullish technical setup
Solana continues to maintain its position above critical support levels as a significant monthly cup and handle formation takes shape. The technical setup remains favorable, though bulls need SOL to defend current support zones and ultimately breach the $98 resistance threshold for confirmation.
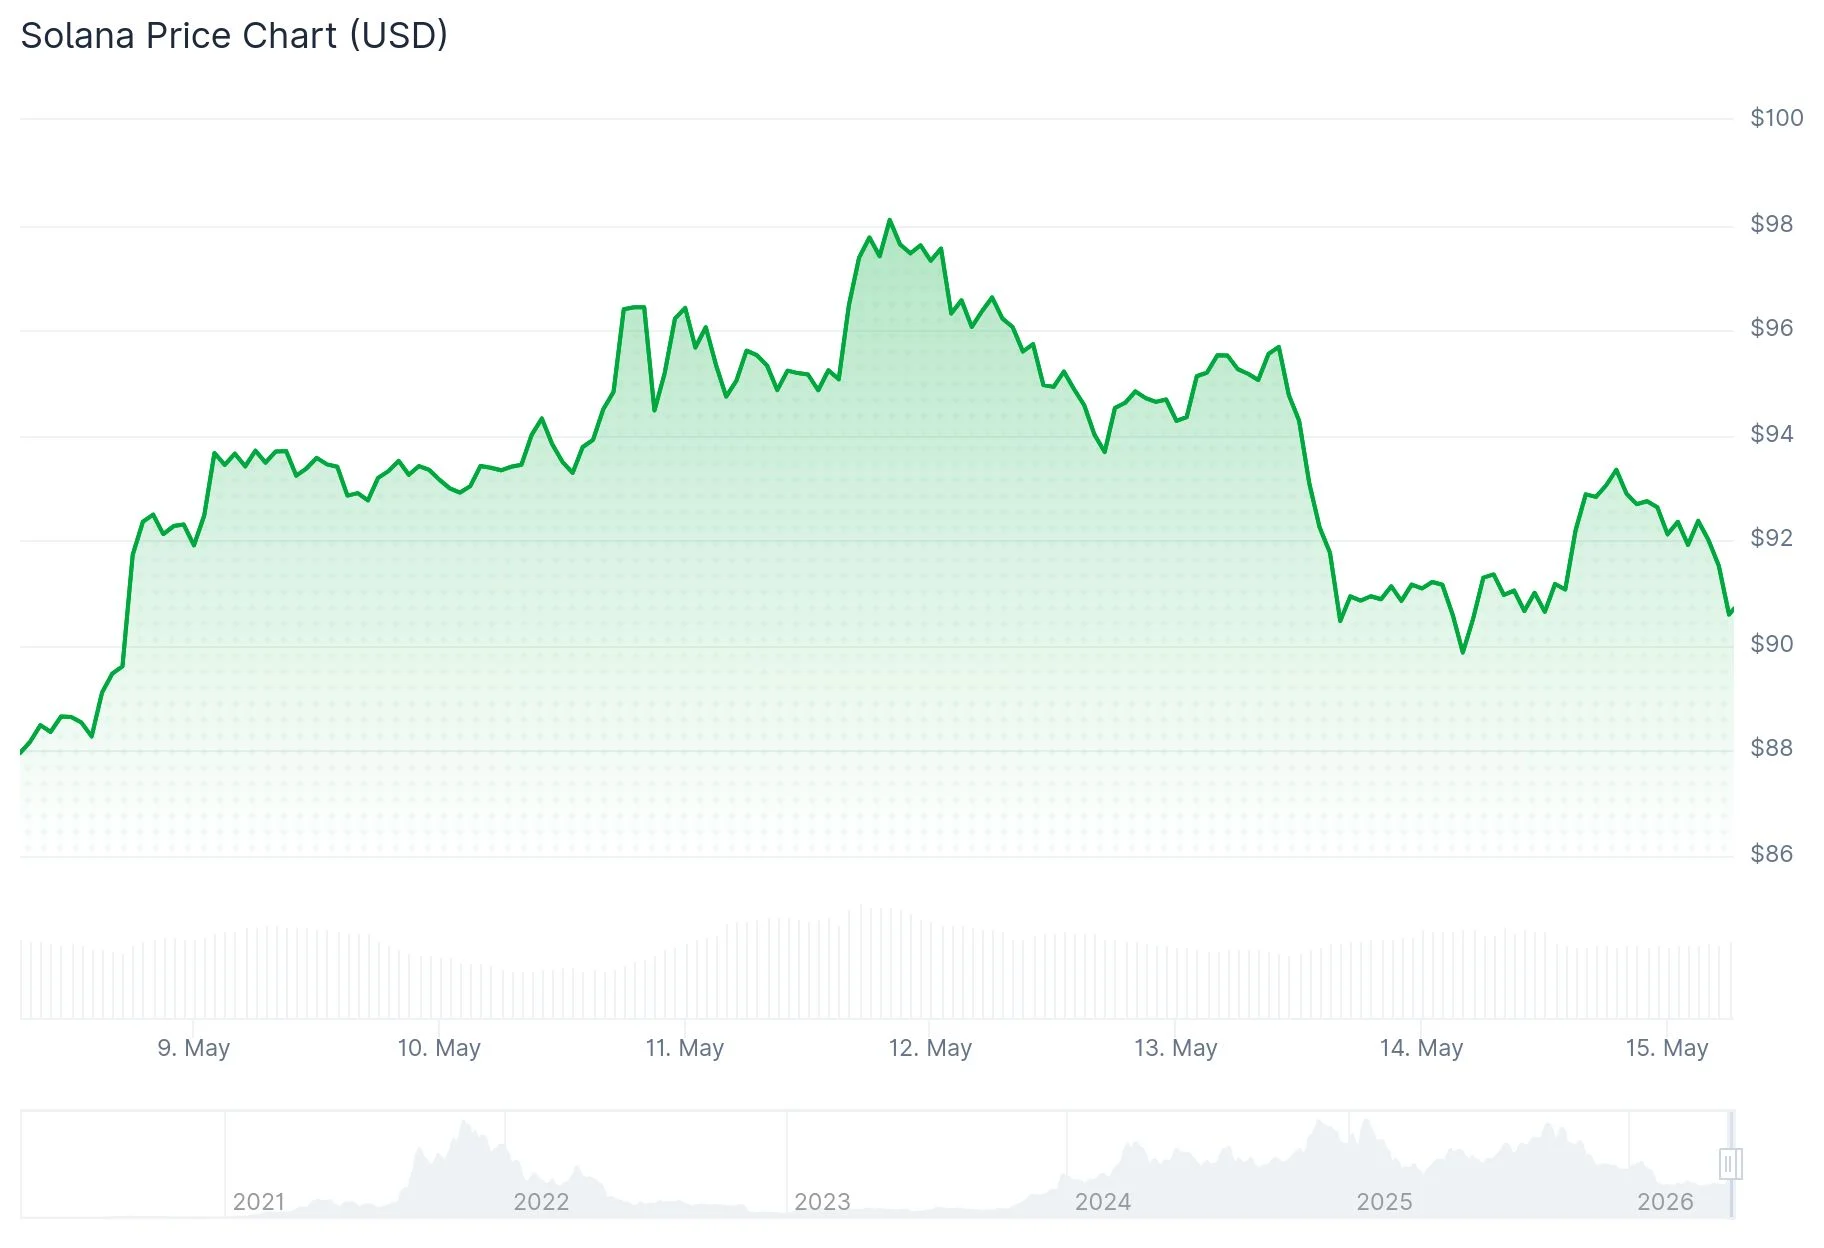
For the past several months starting in February, SOL has been confined to a well-defined trading channel. The range spans from a lower boundary at $78 to an upper limit at $98. Technical analyst Ali Charts has mapped out these key levels, noting that $88 functions as the midpoint pivot.
Recently, SOL attempted to break through the $98 resistance but faced swift rejection at that level. According to Ali Charts, the subsequent price bounce indicates that another challenge of the $98 ceiling may be forming.
Ali Charts projects that a confirmed daily candle close above $98 would establish $107 as the initial upside objective, followed by a secondary target zone around $117. Should $98 prove resilient as resistance, traders should anticipate potential retracements to $88 or even a complete reset toward the $78 support floor.
Large-Scale Cup and Handle Formation Emerges
On the extended monthly timeframe, analyst Bitcoinsensus has spotted a significant cup and handle pattern taking form. Following its peak in 2021, SOL experienced a prolonged decline that reached its nadir throughout 2022 and 2023, before mounting a recovery back toward previous resistance territory.

The handle portion is currently materializing as a sideways consolidation period. With SOL trading near the lower boundary of this handle formation, this trendline represents a crucial zone that buyers must successfully defend.
It’s important to note that this pattern remains unconfirmed. For validation, SOL must clear the upper trendline of the handle and push beyond the broader resistance area established near the 2021 peak levels.
Descending Channel Breakthrough Signals Shift
Crypto analyst CryptoXLARG has observed that SOL has successfully broken free from a prolonged descending channel structure. The asset is now establishing stability within the $92 to $95 price range, potentially laying groundwork for a trend reversal.
A decisive break and hold above $95 would activate upside objectives at $102.70, $106.50, and $118.26. Under stronger momentum conditions, CryptoXLARG identifies extended macro targets reaching as high as $143 and $163 as plausible upside scenarios.
Analyst Bitcoin Meraklısı observed that SOL achieved its initial upside projection following an approximate 10% breakout surge, though selling pressure emerged at that point. A pullback toward the $92 level would still align with a constructive technical structure.
The immediate support foundation sits at $92. Beneath that level, $89 and $78 represent the subsequent support zones to monitor. A breakdown below $78 would compromise the current bullish technical framework.
Analyst Moe has identified that SOL has reclaimed territory above a significant long-term descending trendline originating from the 2021 peak, indicating the broader downtrend structure may be losing strength. SOL has maintained its position above this reclaimed trendline support.
Get 3 Free Stock Ebooks
Discover top-performing stocks in AI, Crypto, and Technology with expert analysis.
- Top 10 AI Stocks - Leading AI companies
- Top 10 Crypto Stocks - Blockchain leaders
- Top 10 Tech Stocks - Tech giants


